![]() Figure 2 of
Uchida, Mol Vis 5:1, 1999.
Figure 2 of
Uchida, Mol Vis 5:1, 1999.
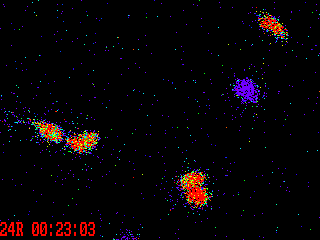
Figure 2. A pseudocolor animation of the responses of five photoreceptor cells to tonic depolarization with 35 mM K+.
After obtaining 3.5 min of baseline data in the presence of 3.6 mM K+, the concentration of K+ was increased to 35 mM, as described in the legend to Figure 1A. Emission-ratio images were acquired at 1 min intervals. The ratio number and time are displayed in the lower left corner of each image frame.
Note that the slide bar at the bottom of the quicktime movie can be used to manually control the flow of the movie. If you do not want to or are unable to view the movie, a representative frame is included below as a still image.
