![]() Figure 4 of
Nickerson, Mol Vis 4:33, 1998.
Figure 4 of
Nickerson, Mol Vis 4:33, 1998.
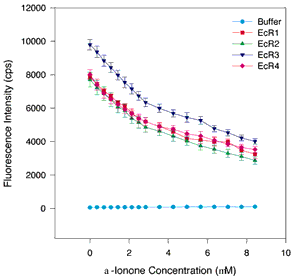
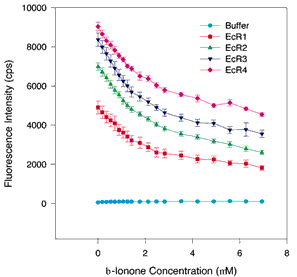
Figure 4. Quenching titrations with ß-ionine and [alpha]-ionine
A. Binding curves with [alpha]-ionine. B. Binding curves with ß-ionine. The same assay conditions were employed as in Figure 1. The symbols and colors are the same as in Figure 1. The error bars indicate the standard error of the mean. A nonsaturable decrease in fluorescence intensity is detected at high ligand concentrations (4 to 8 µM ß-ionine or [alpha]-ionine), but at lower concentrations for both ligands a distinct saturable component is detectable in the 0 to 3 µM range. Curve fitting analyses suggest that the Kds range from 0.21 to 0.56 µM. Both ligands bind to all repeats suggesting that the cyclohexenyl ring structure is sufficient for retinoid binding, but the exact position of the double bond in the ring is not critical for binding or quenching.
A.

B.
