![]() Figure 12 of
Nickerson, Mol Vis 4:33, 1998.
Figure 12 of
Nickerson, Mol Vis 4:33, 1998.
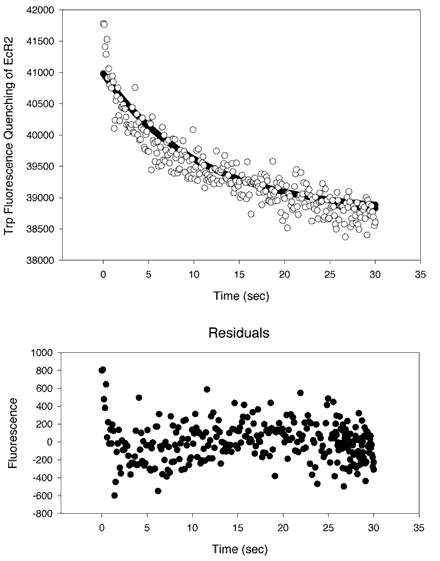
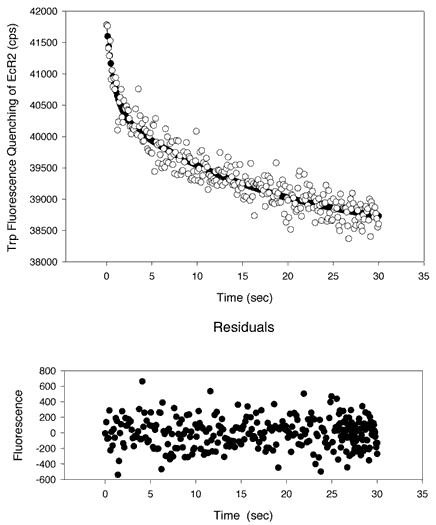
Figure 12. Kinetic measurements of 9-cis-retinal transferring from PC SUVs to EcR2
A kinetic analysis of the transfer of 9-cis-retinal from PC SUVs to EcR2. 9-cis-retinal can quench the intrinsic fluorescence of EcR2 as shown in Figure 2. Equal volumes of a solution of EcR2 at 8 µM in 10 mM Tris, 100 mM NaCl, 2 mM EDTA, pH 7.5 were mixed with a preparation of 5 mol% 9 cis-retinal 95 mol% PC SUVs prepared as in [31]. The phospholipid concentration was 250 µM. The two solutions were mixed with a HiTech SF[alpha]-20M low-volume stopped flow apparatus with pneumatic drive accessory. The pathlengths of the cuvette were 3 mm on both dimensions. Excitation was at 280 nm (0.7 nm bandpass) and emission was at 336 nm (bandpass of 2.8 nm). Integration was for 0.1 s. Thirteen traces were collected and averaged. In Panel A, the data were fitted to a single exponential curve of the form y = yo + ae-bt. The optimal parameters are yo = 38800 cps, a = 2230 cps, and b = 0.111 s-1. However, there was evidence of a nonrandom distribution of the residuals about the abscissa (Y = 0), as shown on the lower plot (residuals versus time). A better fit was obtained, as shown in Panel B, with a double exponential curve of the form y = yo + ae-bt + ce-dt, where yo = 38400 cps, a = 1330 cps, b= 1.17 s-1, c = 2095 cps, and d = 0.0574 s-1. An F-test suggests that the higher order curve is significantly better than a single exponential (p<10-14). The two derived rate half-times are 0.591 s and 12.7 s. The ratio of a to c is 0.635, indicating that both processes, though not equal, contribute sizably to the transfer binding outcome. It is probable that the slower process represents photobleaching of the protein or some other degradative process. The plots both show that 9-cis-retinal was transferred from the PC SUVs to an acceptor, EcR2.
A.

B.
