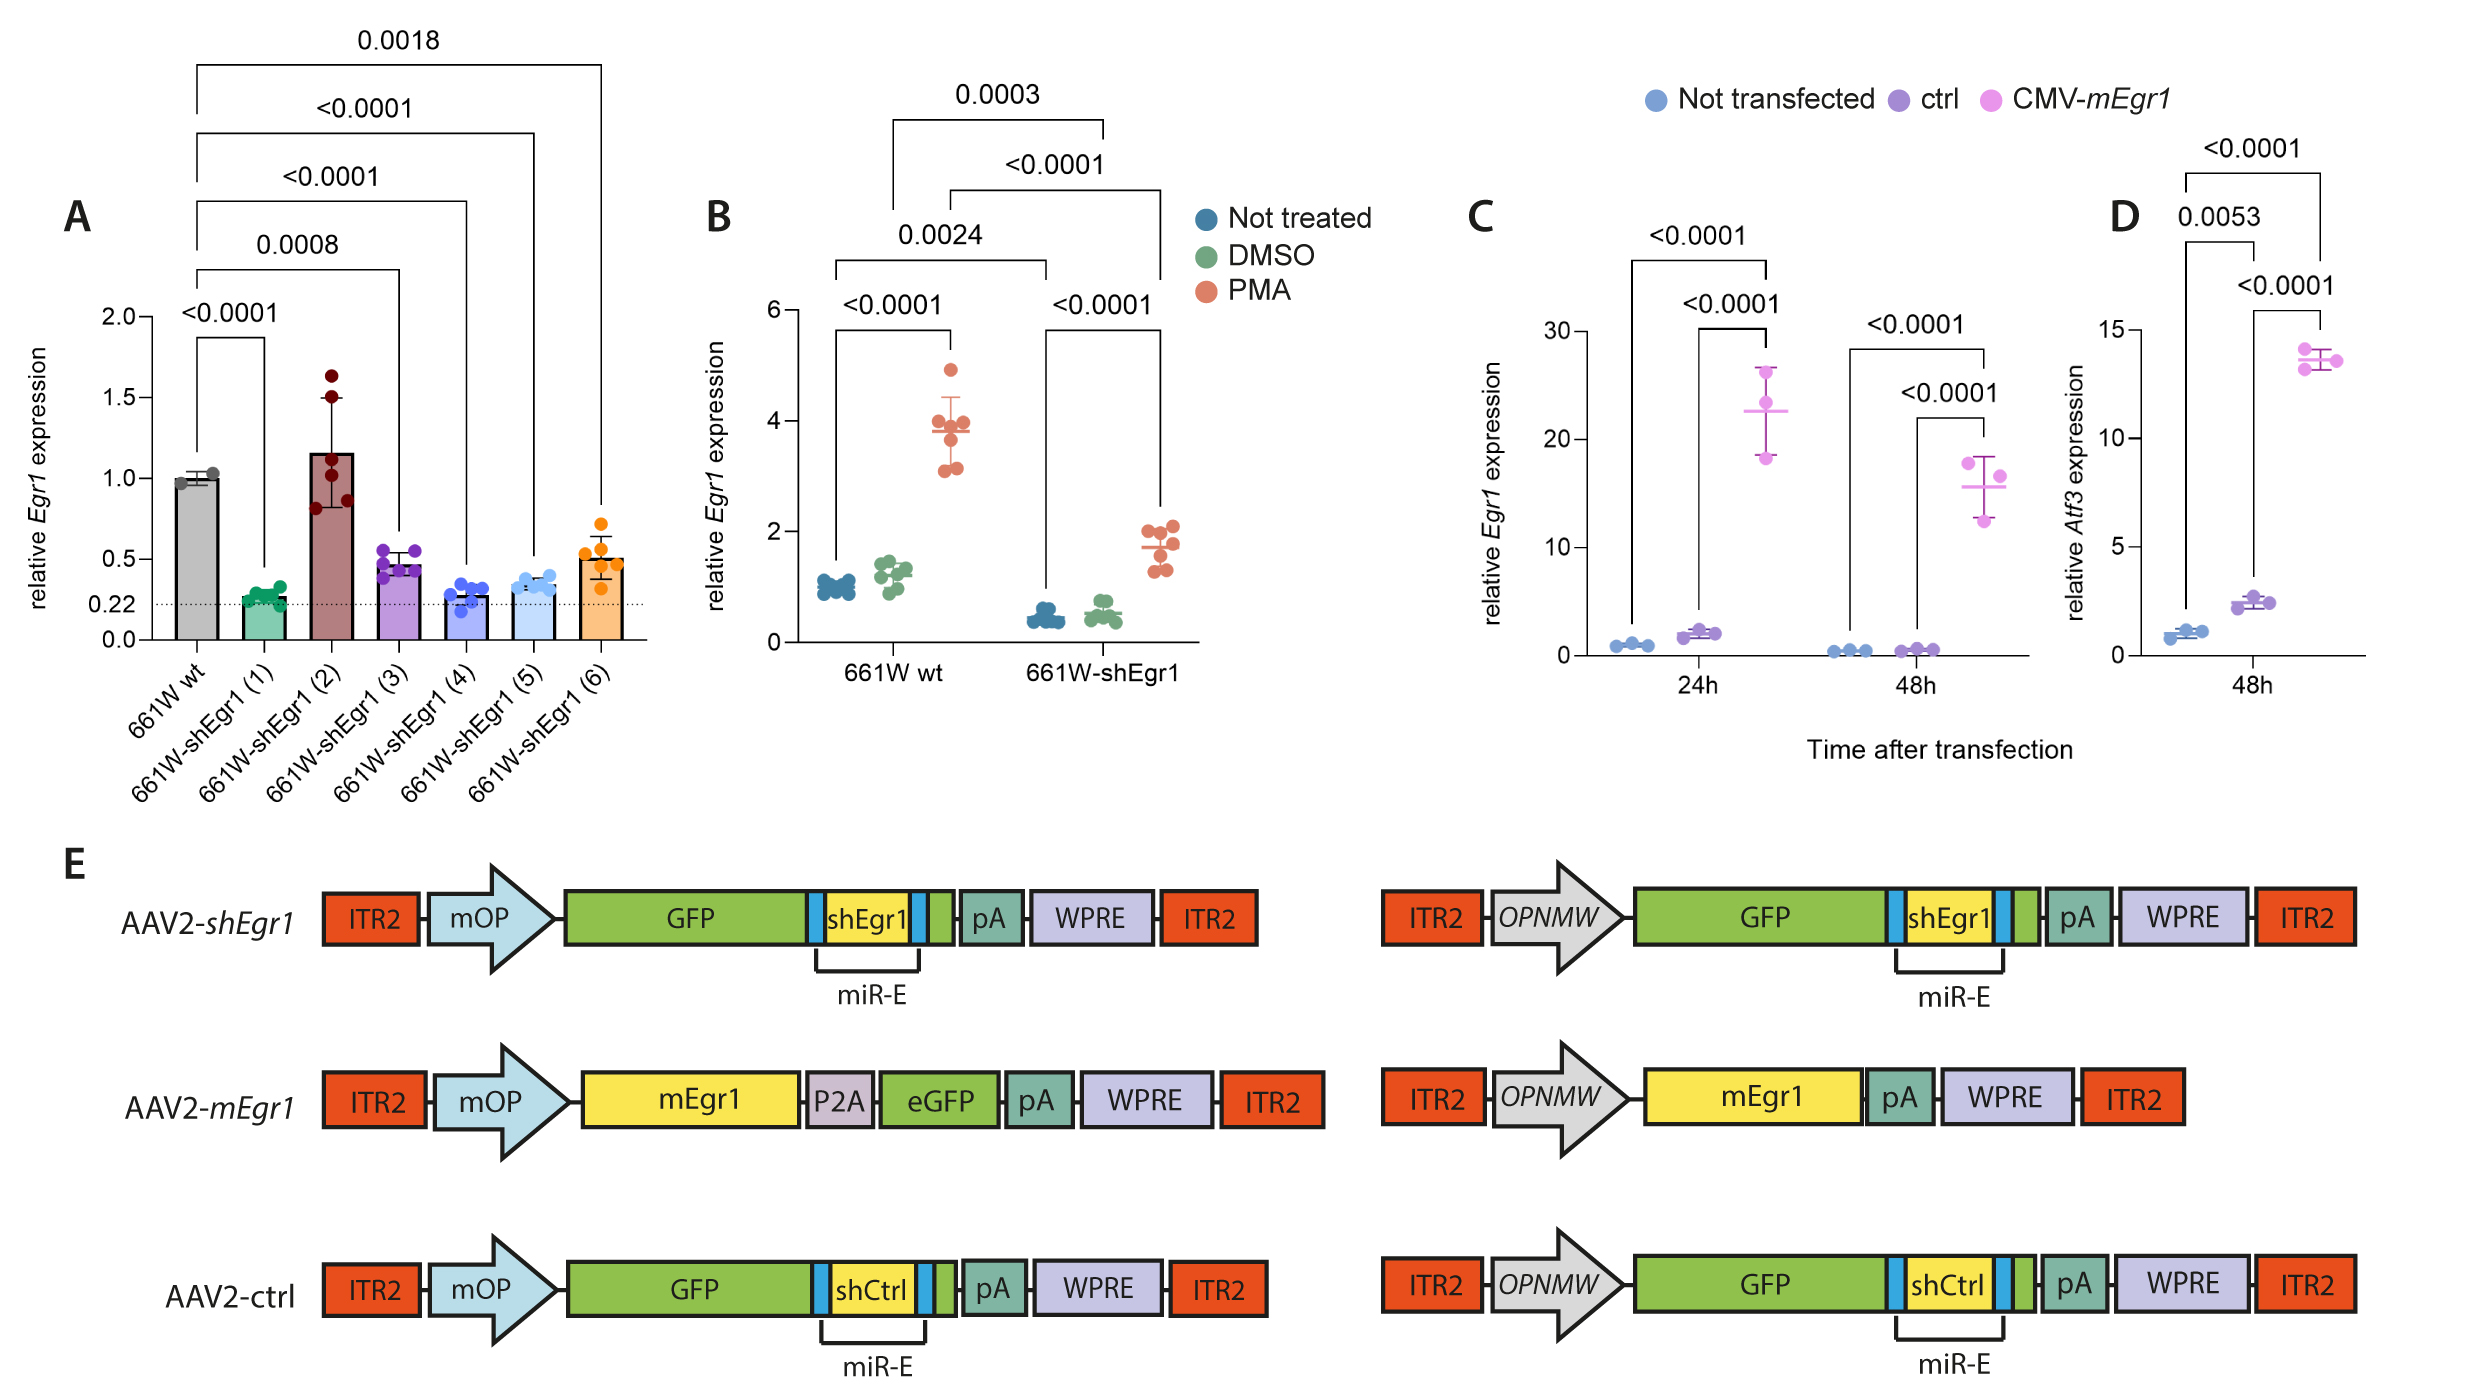
Figure 2. In vitro validation of
shEgr1 and
mEgr1 sequences and design of AAV vectors.
A: Real time PCR for
Egr1 in 661W cell lines stably expressing shEgr1. Each cell line (plotted on the x-axis) expresses a different
shEgr1 sequence (1–6,
Table 1). Sequence (1) showed the strongest downregulation (78%, dotted line) and was chosen for further tests. Shown are individual
data points and means ± SD n=6. One-way ANOVA with Dunnett’s multiple comparisons test, p values as indicated.
B: PMA stress test in 661W wt and 661W-shEgr1 (1) cells. Shown are individual data points and means ± SD n=7. Two-way ANOVA
with Dunnett’s multiple comparisons test, p values as indicated.
C: In vitro test of the
Egr1 overexpression plasmid AAV2::CMV-mEgr1-P2A-eGFP-pA-WPRE (CMV-mEgr1) in 661W cells.
Egr1 mRNA levels were determined at 24 h and 48 h after transfection of the overexpressing plasmid (pink) and compared to cells
that were not transfected (blue) and cells that received the pcDNA3-CMV-eGFP control plasmid (purple). Shown are individual
data points and means ± SD n=3. One-way ANOVA with Tukey’s multiple comparisons test, p values as indicated.
D: Expression levels of the EGR1 target gene
Atf3 in untransfected (blue), ctrl-transfected (purple) and CMV-mEgr1-transfected (pink) cells at 48 h after transfection. Shown
are individual data points and means ± SD n=3. One-way ANOVA with Tukey’s multiple comparisons test, p values as indicated.
E: Schematic representations of the
Egr1 downregulation (AAV2-
shEgr1, top),
Egr1 overexpression (AAV2-
mEgr1, middle), and control (AAV2-ctrl, bottom) AAV vectors. ITR2: inverted terminal repeats of serotype 2; mOP: mouse opsin promoter
(rod-specific);
OPN1MW: human opsin medium wavelength promoter (cone-specific); (e)GFP: (enhanced) green fluorescent protein; pA: poly-A tail; WPRE:
woodchuck hepatitis virus posttranscriptional regulatory element; miR-E: microRNA-E backbone for shRNAs; P2A: 2A self-cleaving
peptide.
 Figure 2 of
Merolla, Mol Vis 2026; 32:102-118.
Figure 2 of
Merolla, Mol Vis 2026; 32:102-118.