Figure 1. Population distribution of the patients in our cohort. The pie-of-pie charts show the percentage of patients with congenital
cataracts who have and do not have hair anomalies. The sub-pie charts show the pathogenic genes identified in the patients
with hair anomalies.
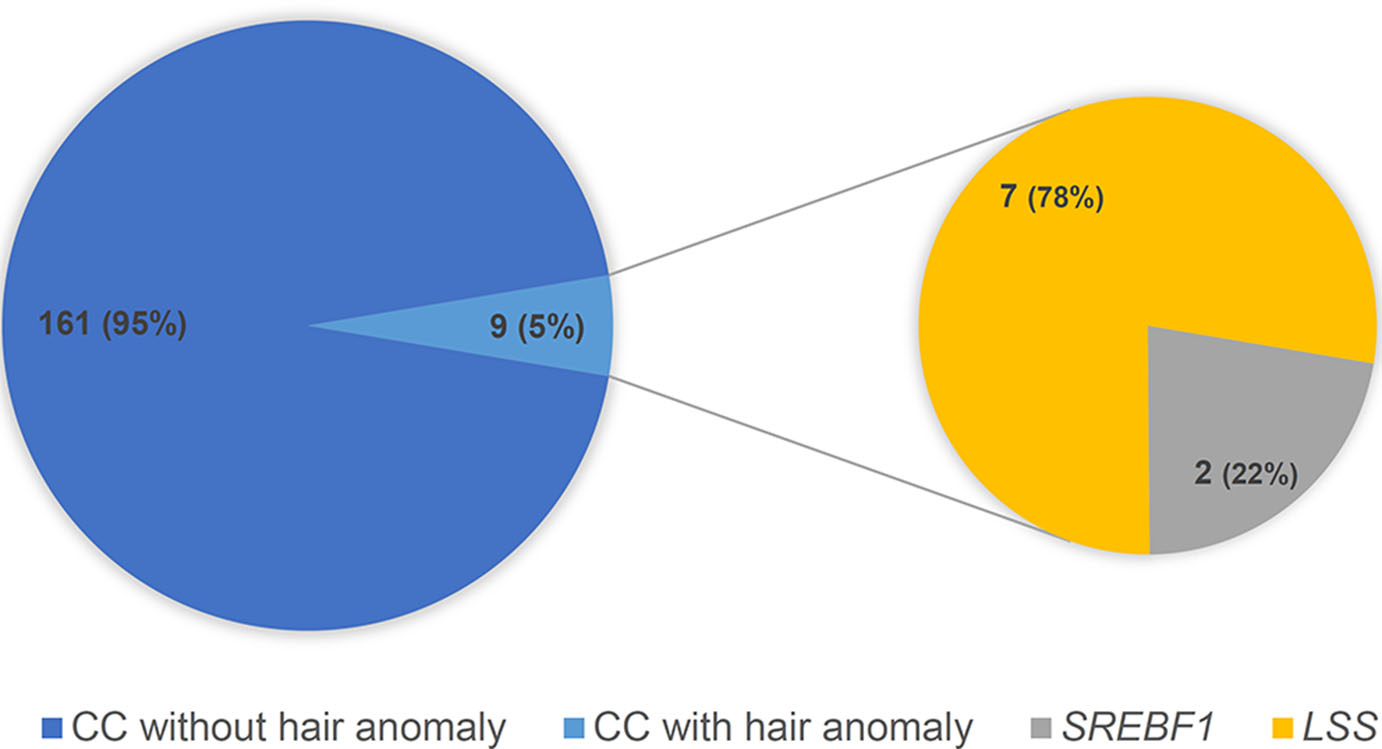
 Figure 1 of
Wang, Mol Vis 2025; 31:221-229.
Figure 1 of
Wang, Mol Vis 2025; 31:221-229.