![]() Figure 6 of
Lin, Mol Vis 3:17, 1997.
Figure 6 of
Lin, Mol Vis 3:17, 1997.
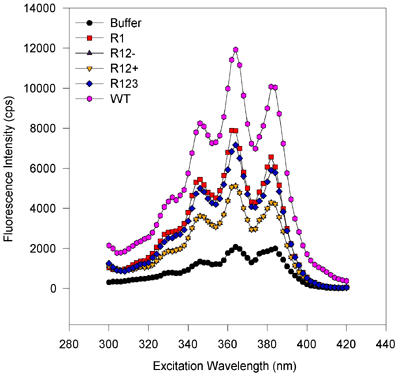
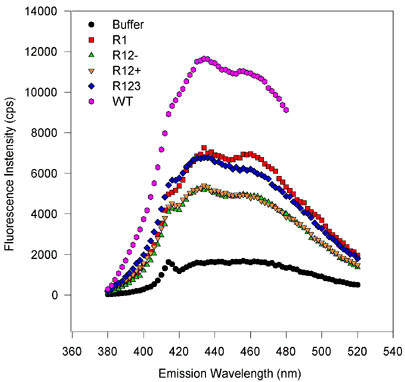
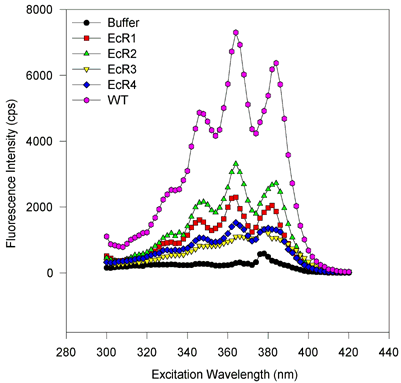
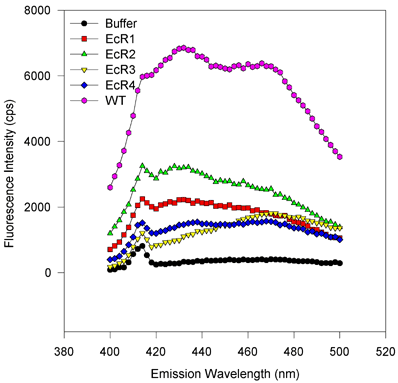
Figure 6. Fluorescence wavelength scans of 16-AP binding to variant and wild type IRBP.
(Excitation and emission scans, proteins expressed in baculovirus and E. coli.)
For excitation scans, the emission wavelength was held at 432 nm while the excitation was scanned from 300 to 420 nm. Fluorescence values were obtained every two nanometers and integrated over 2 s. For emission scans, the excitation wavelength was held at 363 nm while the emission monochromator was varied from 380 or 400 to 520 or 500 nm in 2 nm steps. The signal was integrated for 2 s. The symbols and lines are the same as in Figure 5. [On the emission scan, the small peak at about 416 nm corresponds to the Raman vibrational scattering of water (at 3600 wavenumbers less than the excitation beam of 27550 wavenumbers) and only a small amount of signal is from fluorescence of the ligand. After compensating for the 600 to 700 cps of the water Raman signal, this eliminates this peak or shoulder]. There are no obvious spectral shifts, and only the amplitude of the fluorescence varies from sample to sample. This suggests that only the binding capacities vary from one to the next variant, despite roughly equimolar amounts of protein being scanned. The magnitude of fluorescence enhancement upon ligand binding to protein suggests that binding markedly reduces rotational dispersion of absorbed light energy.
Figure 6a. Excitation scans, baculovirus-expressed proteins.

Figure 6b. Emission scans, baculovirus-expressed proteins

Figure 6c. Excitation scans, E. coli-expressed proteins

Figure 6d. Emission scans, E. coli-expressed proteins
