![]() Figure 7 of
Phillips, Mol Vis 3:12, 1997.
Figure 7 of
Phillips, Mol Vis 3:12, 1997.
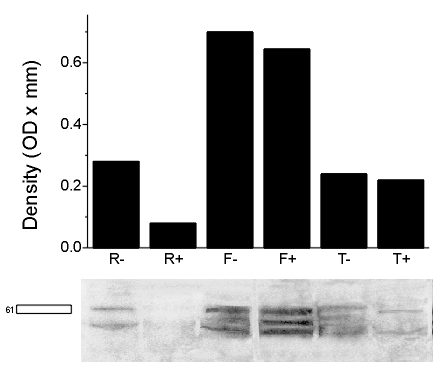
Figure 7. The effect of treatment with antisense oligonucleotide to R-cognin on GAD in E8 retina, forebrain, and tectum
For the Western blot each lane containing 15 µg total protein was probed with anti-GAD (diluted 1:1000) and was exposed for 20 sec. The area used to quantitate the 61 kDa GAD band is indicated by the box. The notation is as in Figure 6: R- (retina without antisense oligonucleotide), R+ (retina treated with antisense oligonucleotide), F- (forebrain without antisense oligonucleotide), F+ (forebrain treated with antisense oligonucleotide), T- (optic tectum without antisense oligonucleotide), T+ (optic tectum treated with antisense oligonucleotide).
