![]() Figure 6 of
Phillips, Mol Vis 3:12, 1997.
Figure 6 of
Phillips, Mol Vis 3:12, 1997.
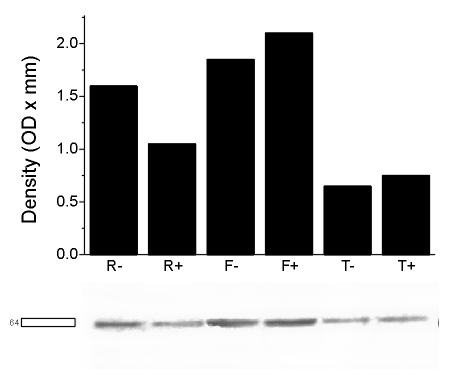
Figure 6. The effect of treatment with antisense oligonucleotide to R-cognin on ChAT in E8 retina, forebrain, and tectum
For the Western blot, each lane containing 15 µg total protein was probed with anti-ChAT (diluted 1:1000) and was exposed for 20 sec. The area used to quantitate the 64 kDa ChAT band is indicated by the box. The notation on the bottom of the bar graph is as follows: R- (retina without antisense oligonucleotide), R+ (retina treated with antisense oligonucleotide), F- (forebrain without antisense oligonucleotide), F+ (forebrain treated with antisense oligonucleotide), T- (optic tectum without antisense oligonucleotide), T+ (optic tectum treated with antisense oligonucleotide).
