Figure 3. The U-Net model trained on biased data is sensitive enough to quantify the strength of interventions. A: Analysis of U-Net’s ability to detect true positive differences in controlled sprouting experiments with different strengths
of intervention. The U-Net model was trained on the biased segmentation generated by removing one random sprout in group 2
(adversarial approach 1). The data comprised 200 samples from the data set selected based on the ground truth cumulative sprouting
length per spheroid (CSLPS; manually annotated data set). The U-Net readout for the same images is shown (the U-Net annotated
data set). B: Evaluation of the sensitivity of the U-Net model trained on biased segmentation generated by removing two pixels from every
sprout in group 2 (adversarial approach 2). Three different strengths of the intervention were simulated by selecting 200
random images for the control and intervention groups based on the ground truth CSLPS (the manually annotated data set). The
U-Net readout for the same images was then compared (the U-Net annotated data set).
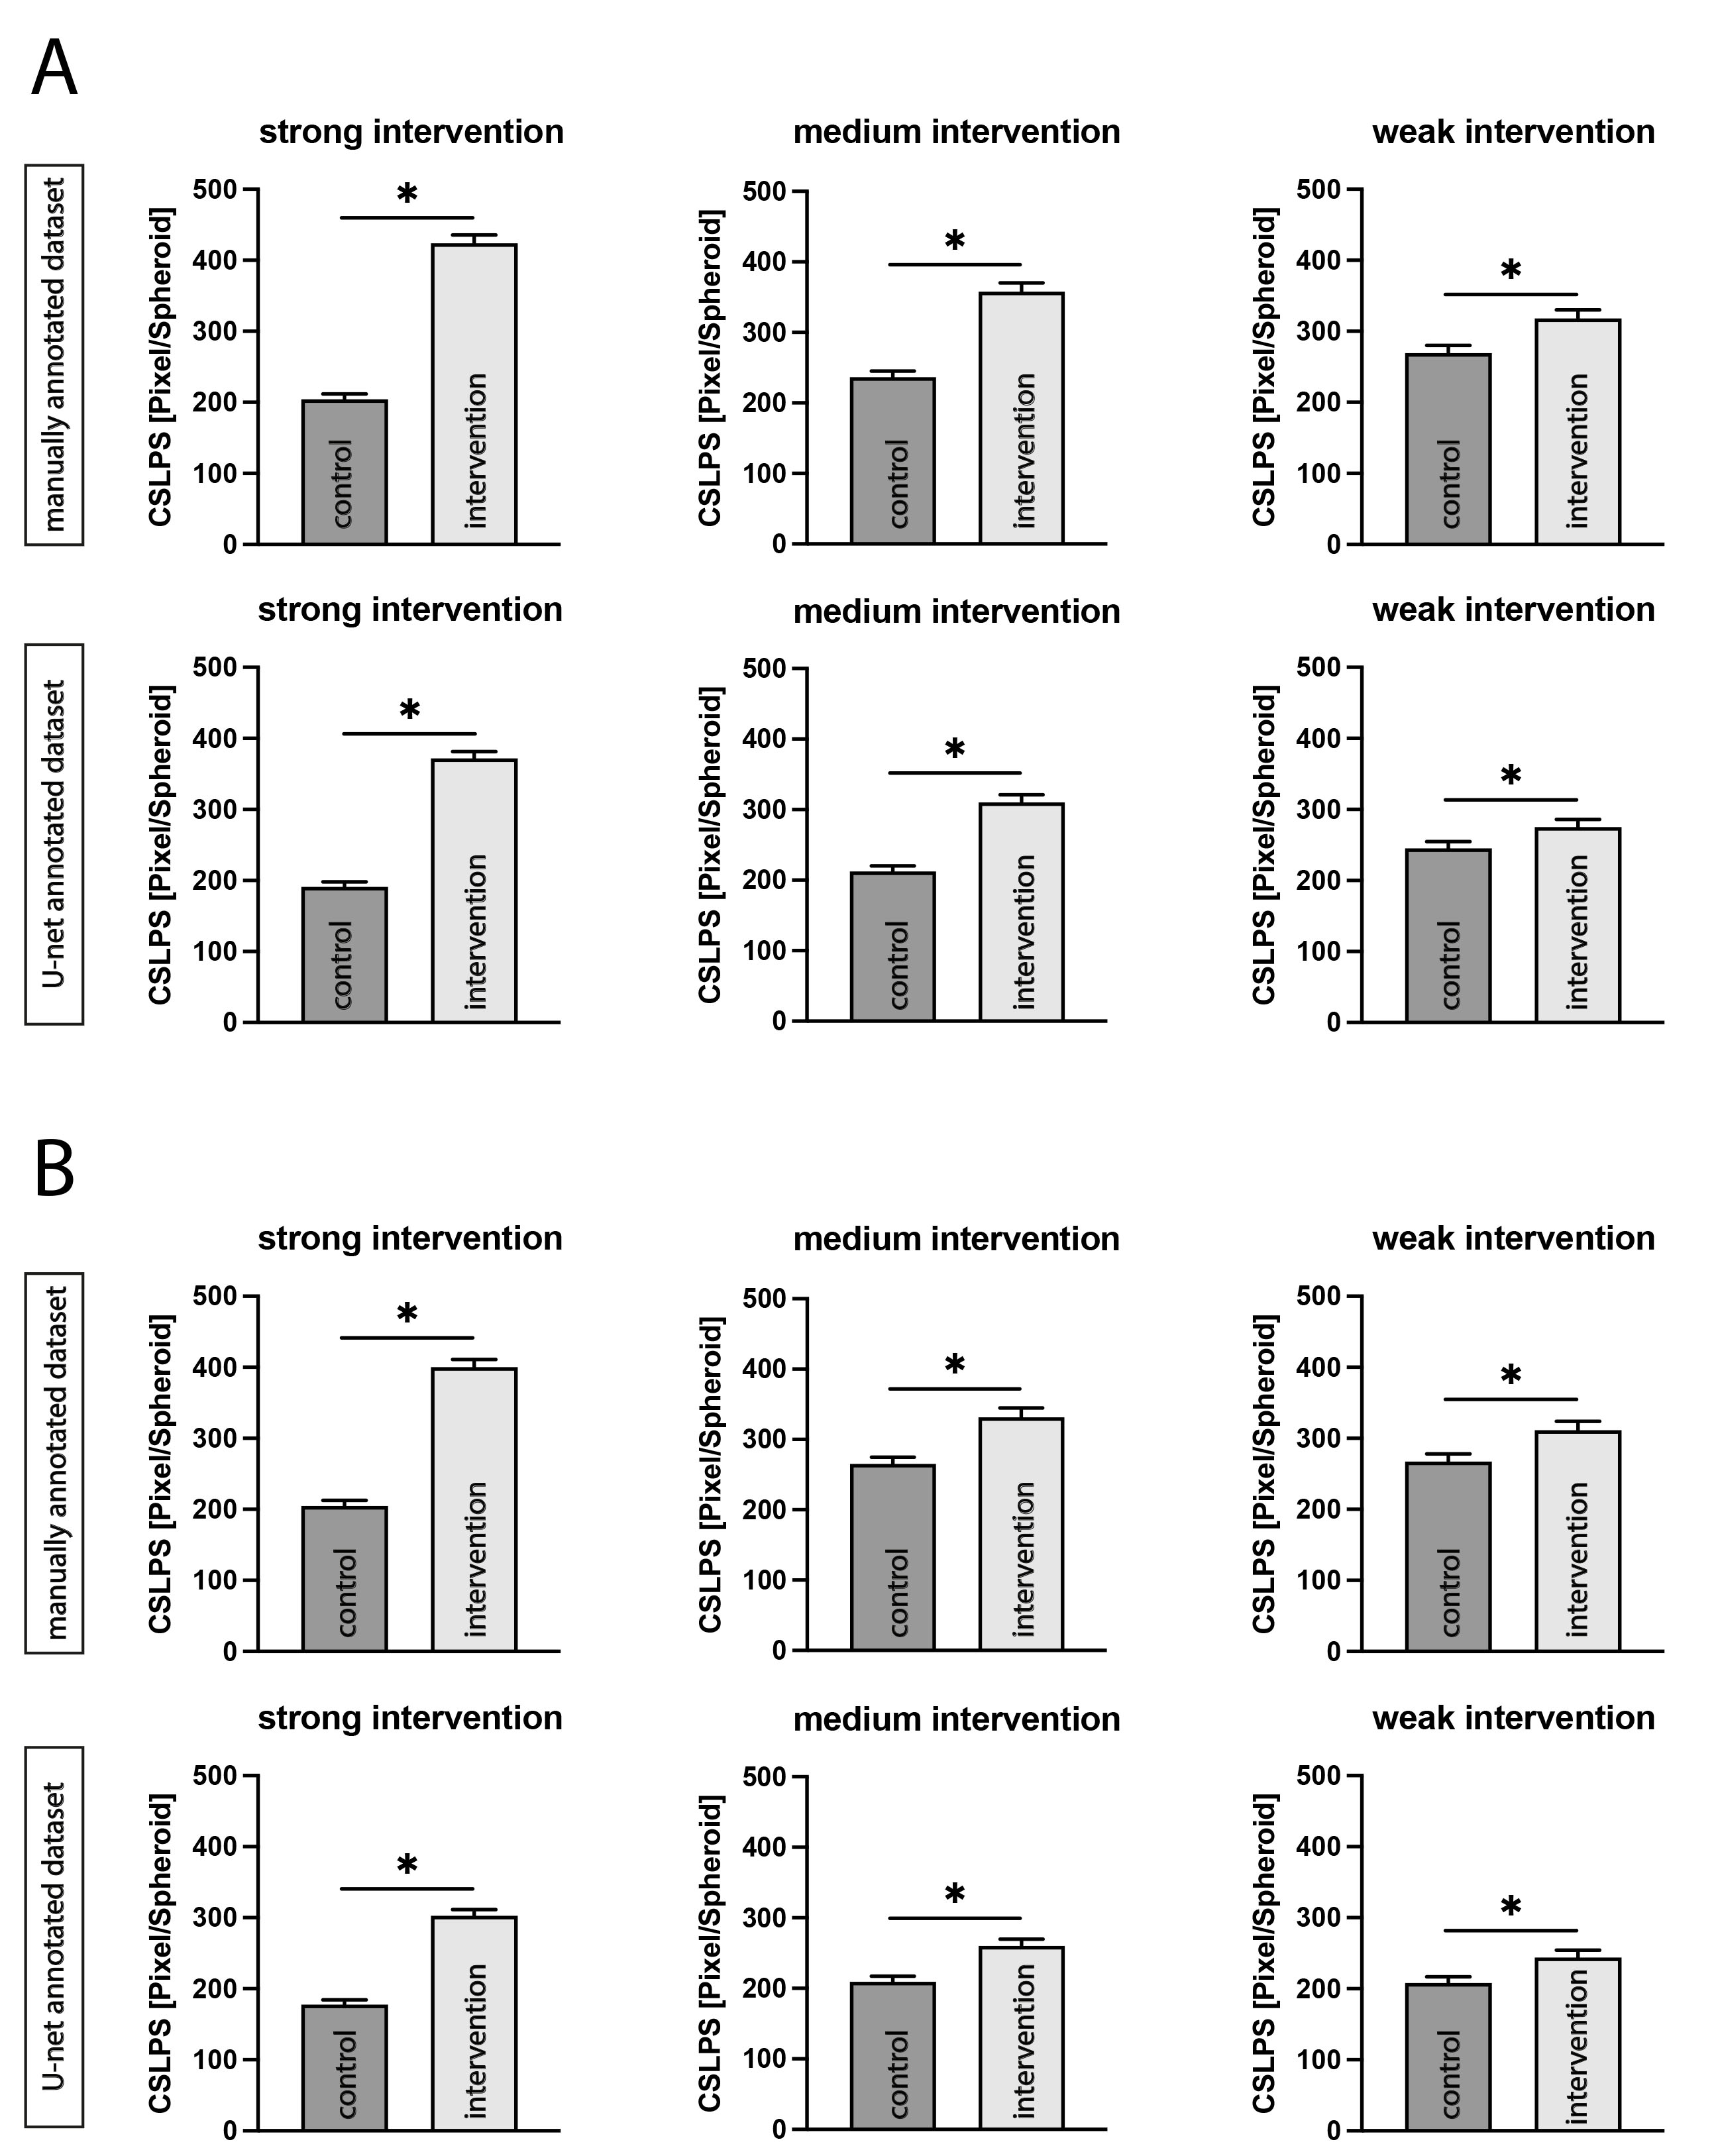
 Figure 3 of
Rapp, Mol Vis 2023; 29:197-205.
Figure 3 of
Rapp, Mol Vis 2023; 29:197-205.