Figure 1. Visualization of the methods for evaluating U-Net’s ability to remove systematic bias in a data set. A: A pipeline to train a U-Net model on a partially biased data set. Images were randomly assigned to group 1 or group 2. Systematic
bias was induced in group 2 by removing one random sprout in every other image, resulting in group 2b. The U-Net model was
trained on images from group 1 and group 2b and then used to reanalyze the same images. B: The approach to assess U-Net’s ability to mitigate an adversarial bias. Images from group 1 and group 2b were compared to
determine if there were statistically significant differences, indicating sufficient bias. The U-Net model was then trained
on these images and used to reanalyze them. The results from the two groups were again compared to determine if there were
statistically significant differences. C: The method for testing U-Net’s ability to detect a true positive effect. Fictitious control and intervention groups were
generated based on an unbiased, manually annotated ground truth data set. They had a statistically significant true positive
difference. A biased data set was then generated, and the U-Net model was trained on the data set. The U-Net model was then
used to reanalyze the same images to determine if it could also detect a statistically significant true positive difference
despite being trained on the biased data set.
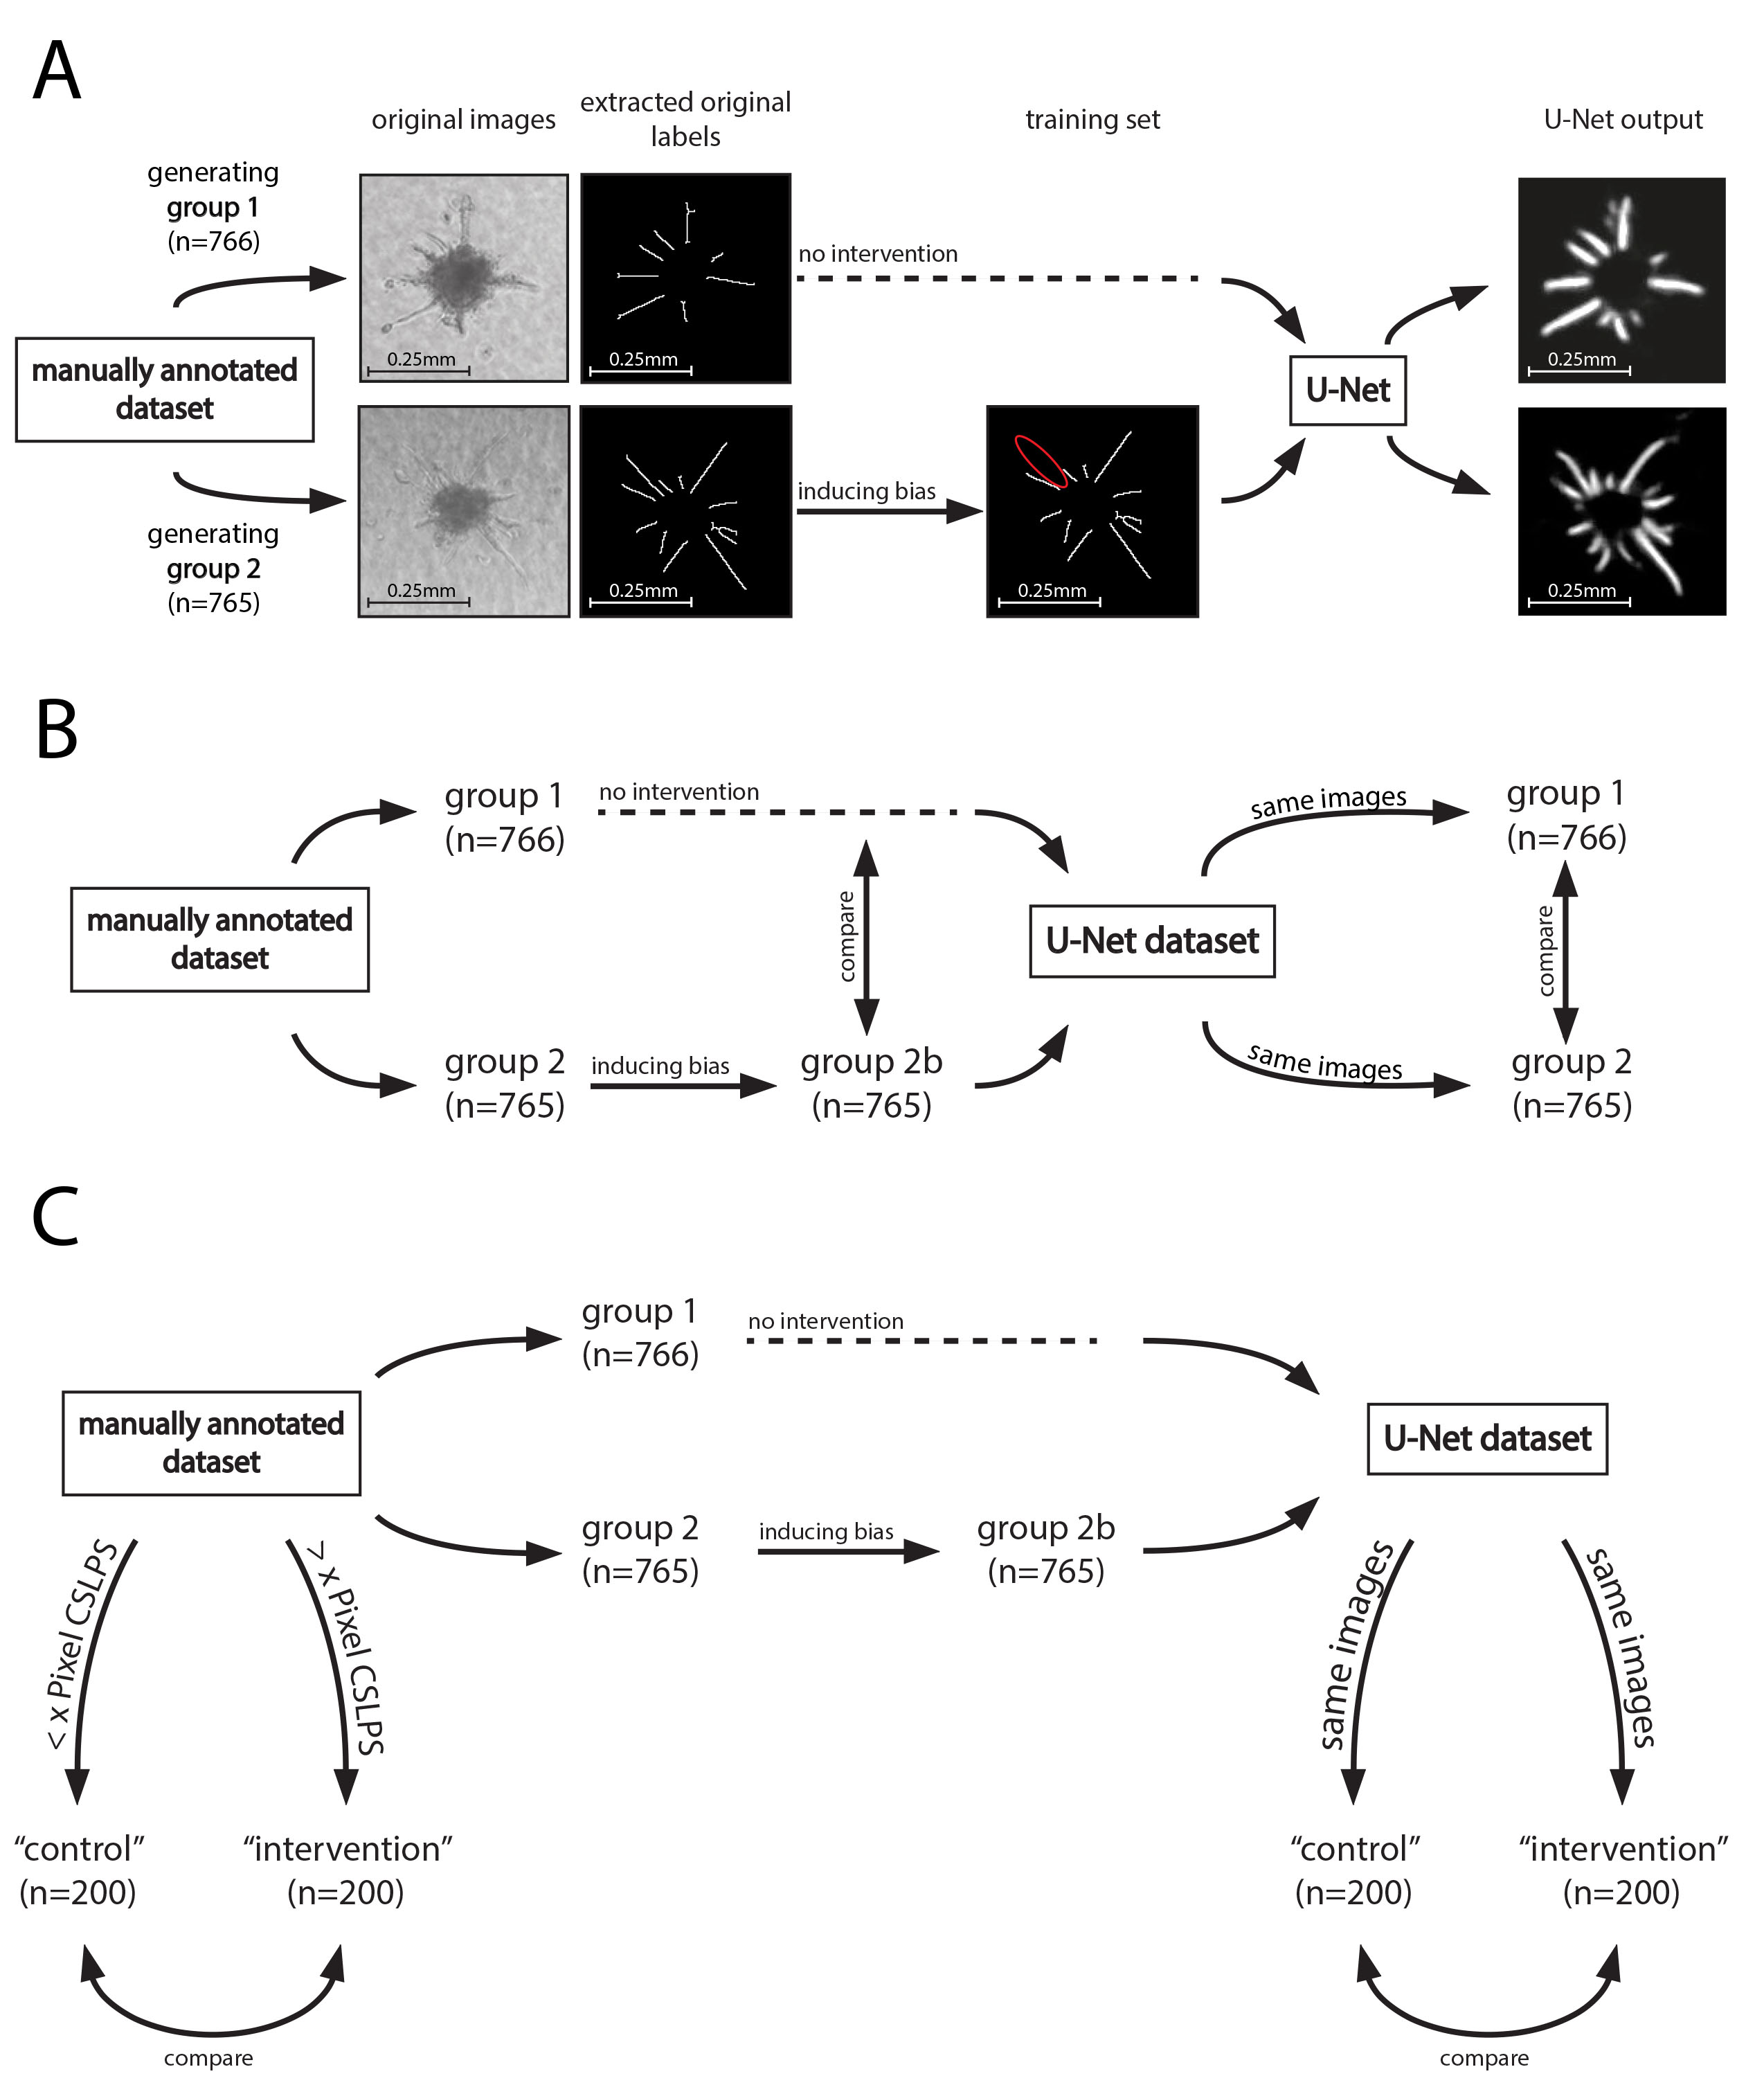
 Figure 1 of
Rapp, Mol Vis 2023; 29:197-205.
Figure 1 of
Rapp, Mol Vis 2023; 29:197-205.