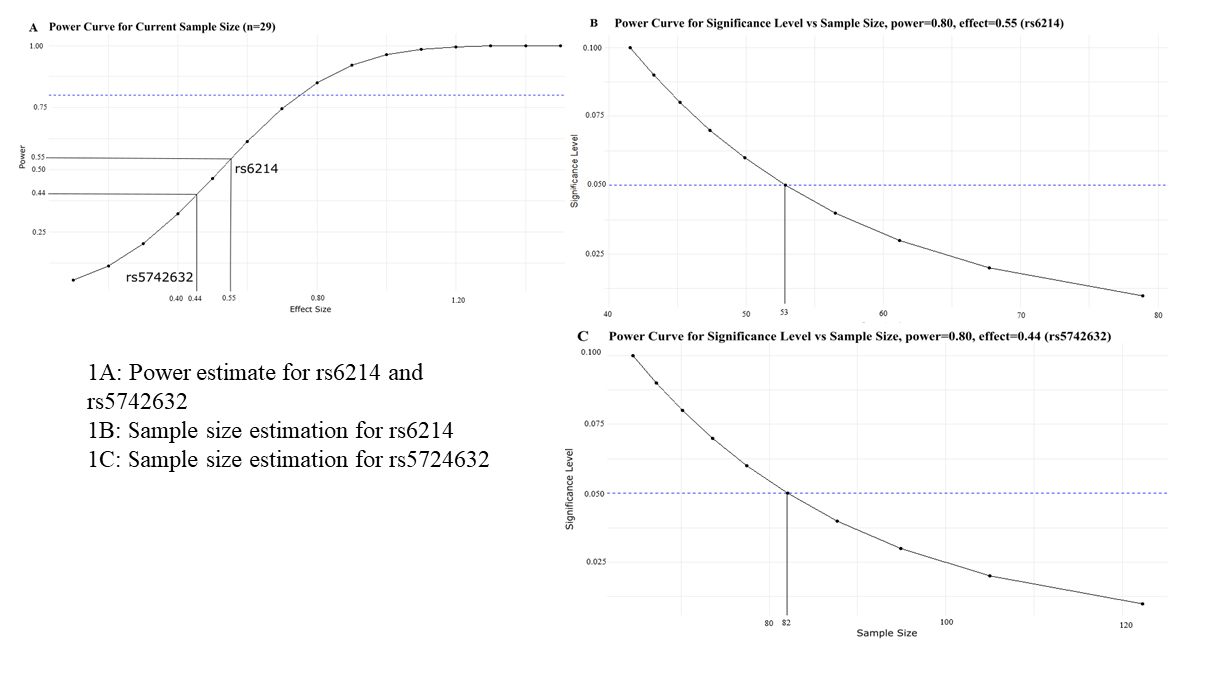
Figure 1. Line plots for power calculations and estimation of power based on effect size(s) obtained in the current study for EOM analysis.
A: The power curve for the sample size of 29 showed that the test had a power of 0.55 and 0.44 for
rs6214 and
rs5742632, respectively. The blue dotted line indicates the required power (i.e., 0.80). It is obvious from the plot that with our
current sample size of 29 and at α = 0.05, the effect size must be close to 0.80 to attain the desired power.
B: The power curve estimated a minimum sample size of 53 to achieve the desired 80% power for an effect size of 0.55 for
rs6214 association analysis, and the current sample size of 29 EOMs made the analysis underpowered. The blue dotted line indicates
the level of significance (i.e., 0.05).
C: The power curve estimated the minimum sample size (82) to achieve the desired 80% power for effect size of 0.44 for
rs5742632 association analysis, and the current sample size of 29 EOMs made the analysis underpowered. The blue dotted line indicates
the level of significance (i.e., 0.05). Both
Figure 1B,C also indicate that sample size might also be increased while changing the level of significance, and more samples may even
be needed to estimate true estimation with the current effect sizes.
 Figure 1 of
Zehra, Mol Vis 2022; 28:369-377.
Figure 1 of
Zehra, Mol Vis 2022; 28:369-377.