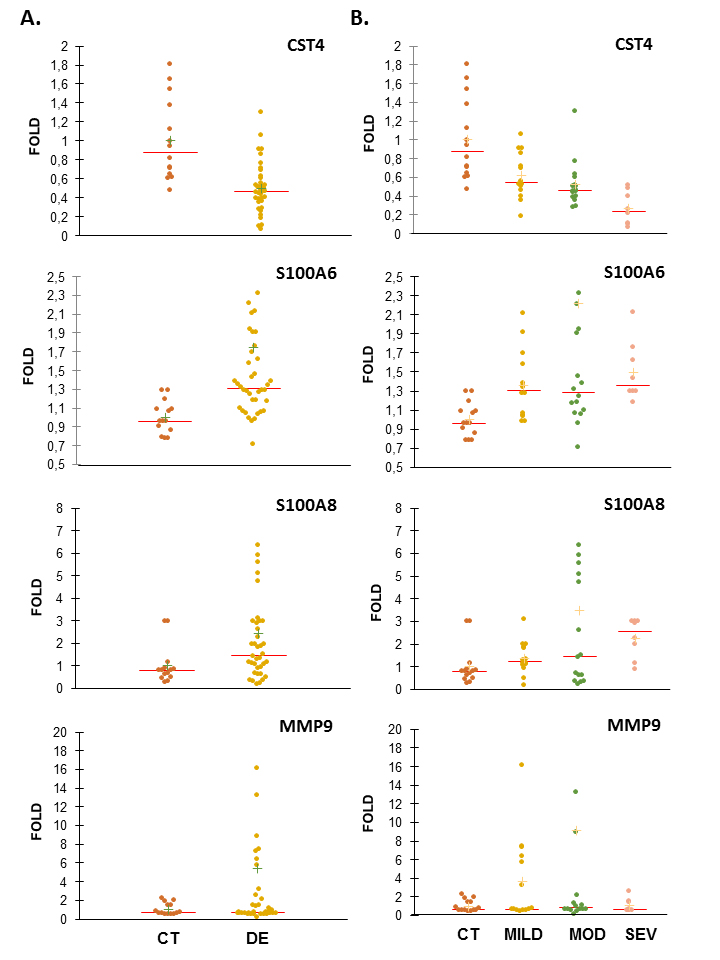
Figure 2. Dot plots depicting changes in the concentration of CST4, S100A6, S100A8, and MMP9 proteins.
A: Comparison of the results for the entire DE group (n = 32) and CT group (n = 14).
B: Changes in the DE group categorized by severity status: mild (MILD; n = 11), moderate (MOD; n = 14), and severe (SEV; n
= 7), in comparison with the CT group. The (+) indicates the mean and the red line indicates the median. The significance
of the results is shown in
Table 4.
 Figure 2 of
Benitez-del-Castillo, Mol Vis 2021; 27:243-261.
Figure 2 of
Benitez-del-Castillo, Mol Vis 2021; 27:243-261.