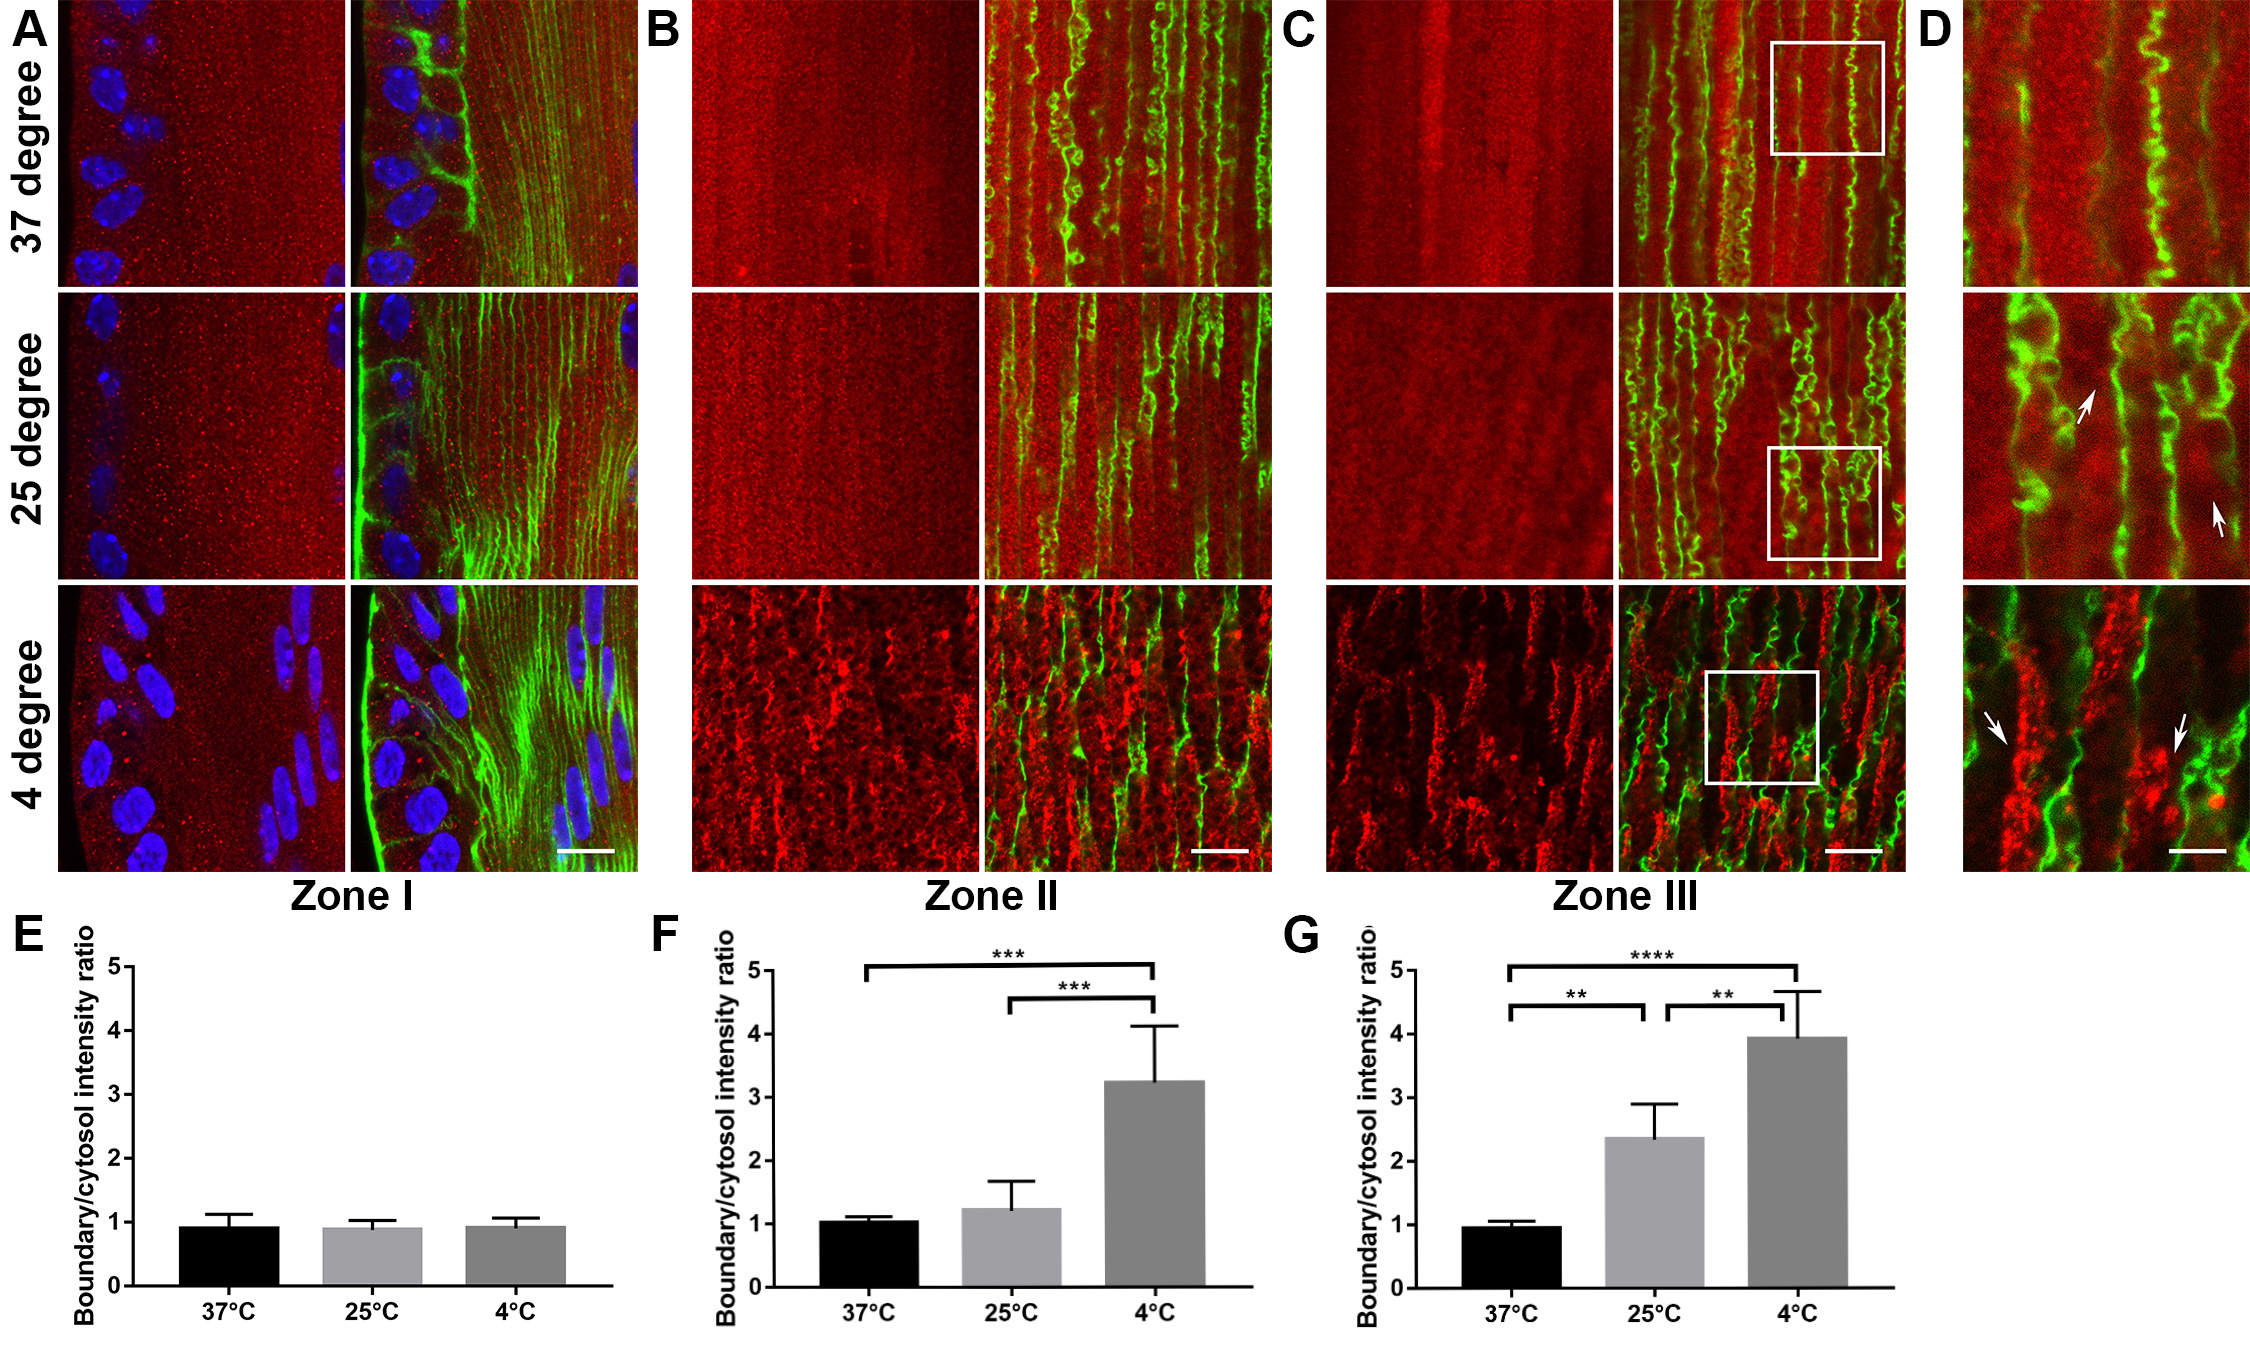
Figure 3. Confocal fluorescent images show filensin protein distribution in lens fibers at zone I, zone II, and zone III from the 37
°C, 25 °C, and 4 °C treated B6WT lenses. The lens A/P sectional samples were immunolabeled with anti-filensin antibody (red),
fluorescein (FITC)-phalloidin (green), and 4’,6-diamidino-2-phenylindole (DAPI; blue). The left panels are filensin alone,
and the right panels are merged with F-actin and nuclei.
A,
B, and
C represent an area (50 μm × 50 μm) of fibers located in 0–50, 325–375, and 425–475 μm from the lens equatorial surface, respectively
(see the locations of zones I, II, and III in
A,
B, and
C, respectively, illustrated in
Figure 5).
D: Enlarged images of the white-box regions in zone III (
C); white arrows indicate filensin accumulation.
E,
F, and
G: Bar graphs show that filensin staining intensity ratios between fiber cell boundaries versus the cytosol in zones I, II,
and III were quantitatively measured and compared as mean ± standard deviation (SD; n = 3, per sample group).
E: Among three different temperatures, the distribution of CP49 showed no statistically significant difference in zone I. However,
the CP49 boundary/cytosolic intensity ratio in the 4 °C treated fibers was statistically significantly higher than those in
the 37 °C and 25 °C treated fibers in zone II (
F, ***p≤0.001), and the comparisons among the 4 °C, 25 °C, and 37 °C treated fibers in zone III showed statistically significant
differences (
G, **p≤0.01, ****p≤0.0001). Scale bar:
A–
C, 10 μm;
D, 4 μm.
 Figure 3 of
Li, Mol Vis 2020; 26:603-612.
Figure 3 of
Li, Mol Vis 2020; 26:603-612.