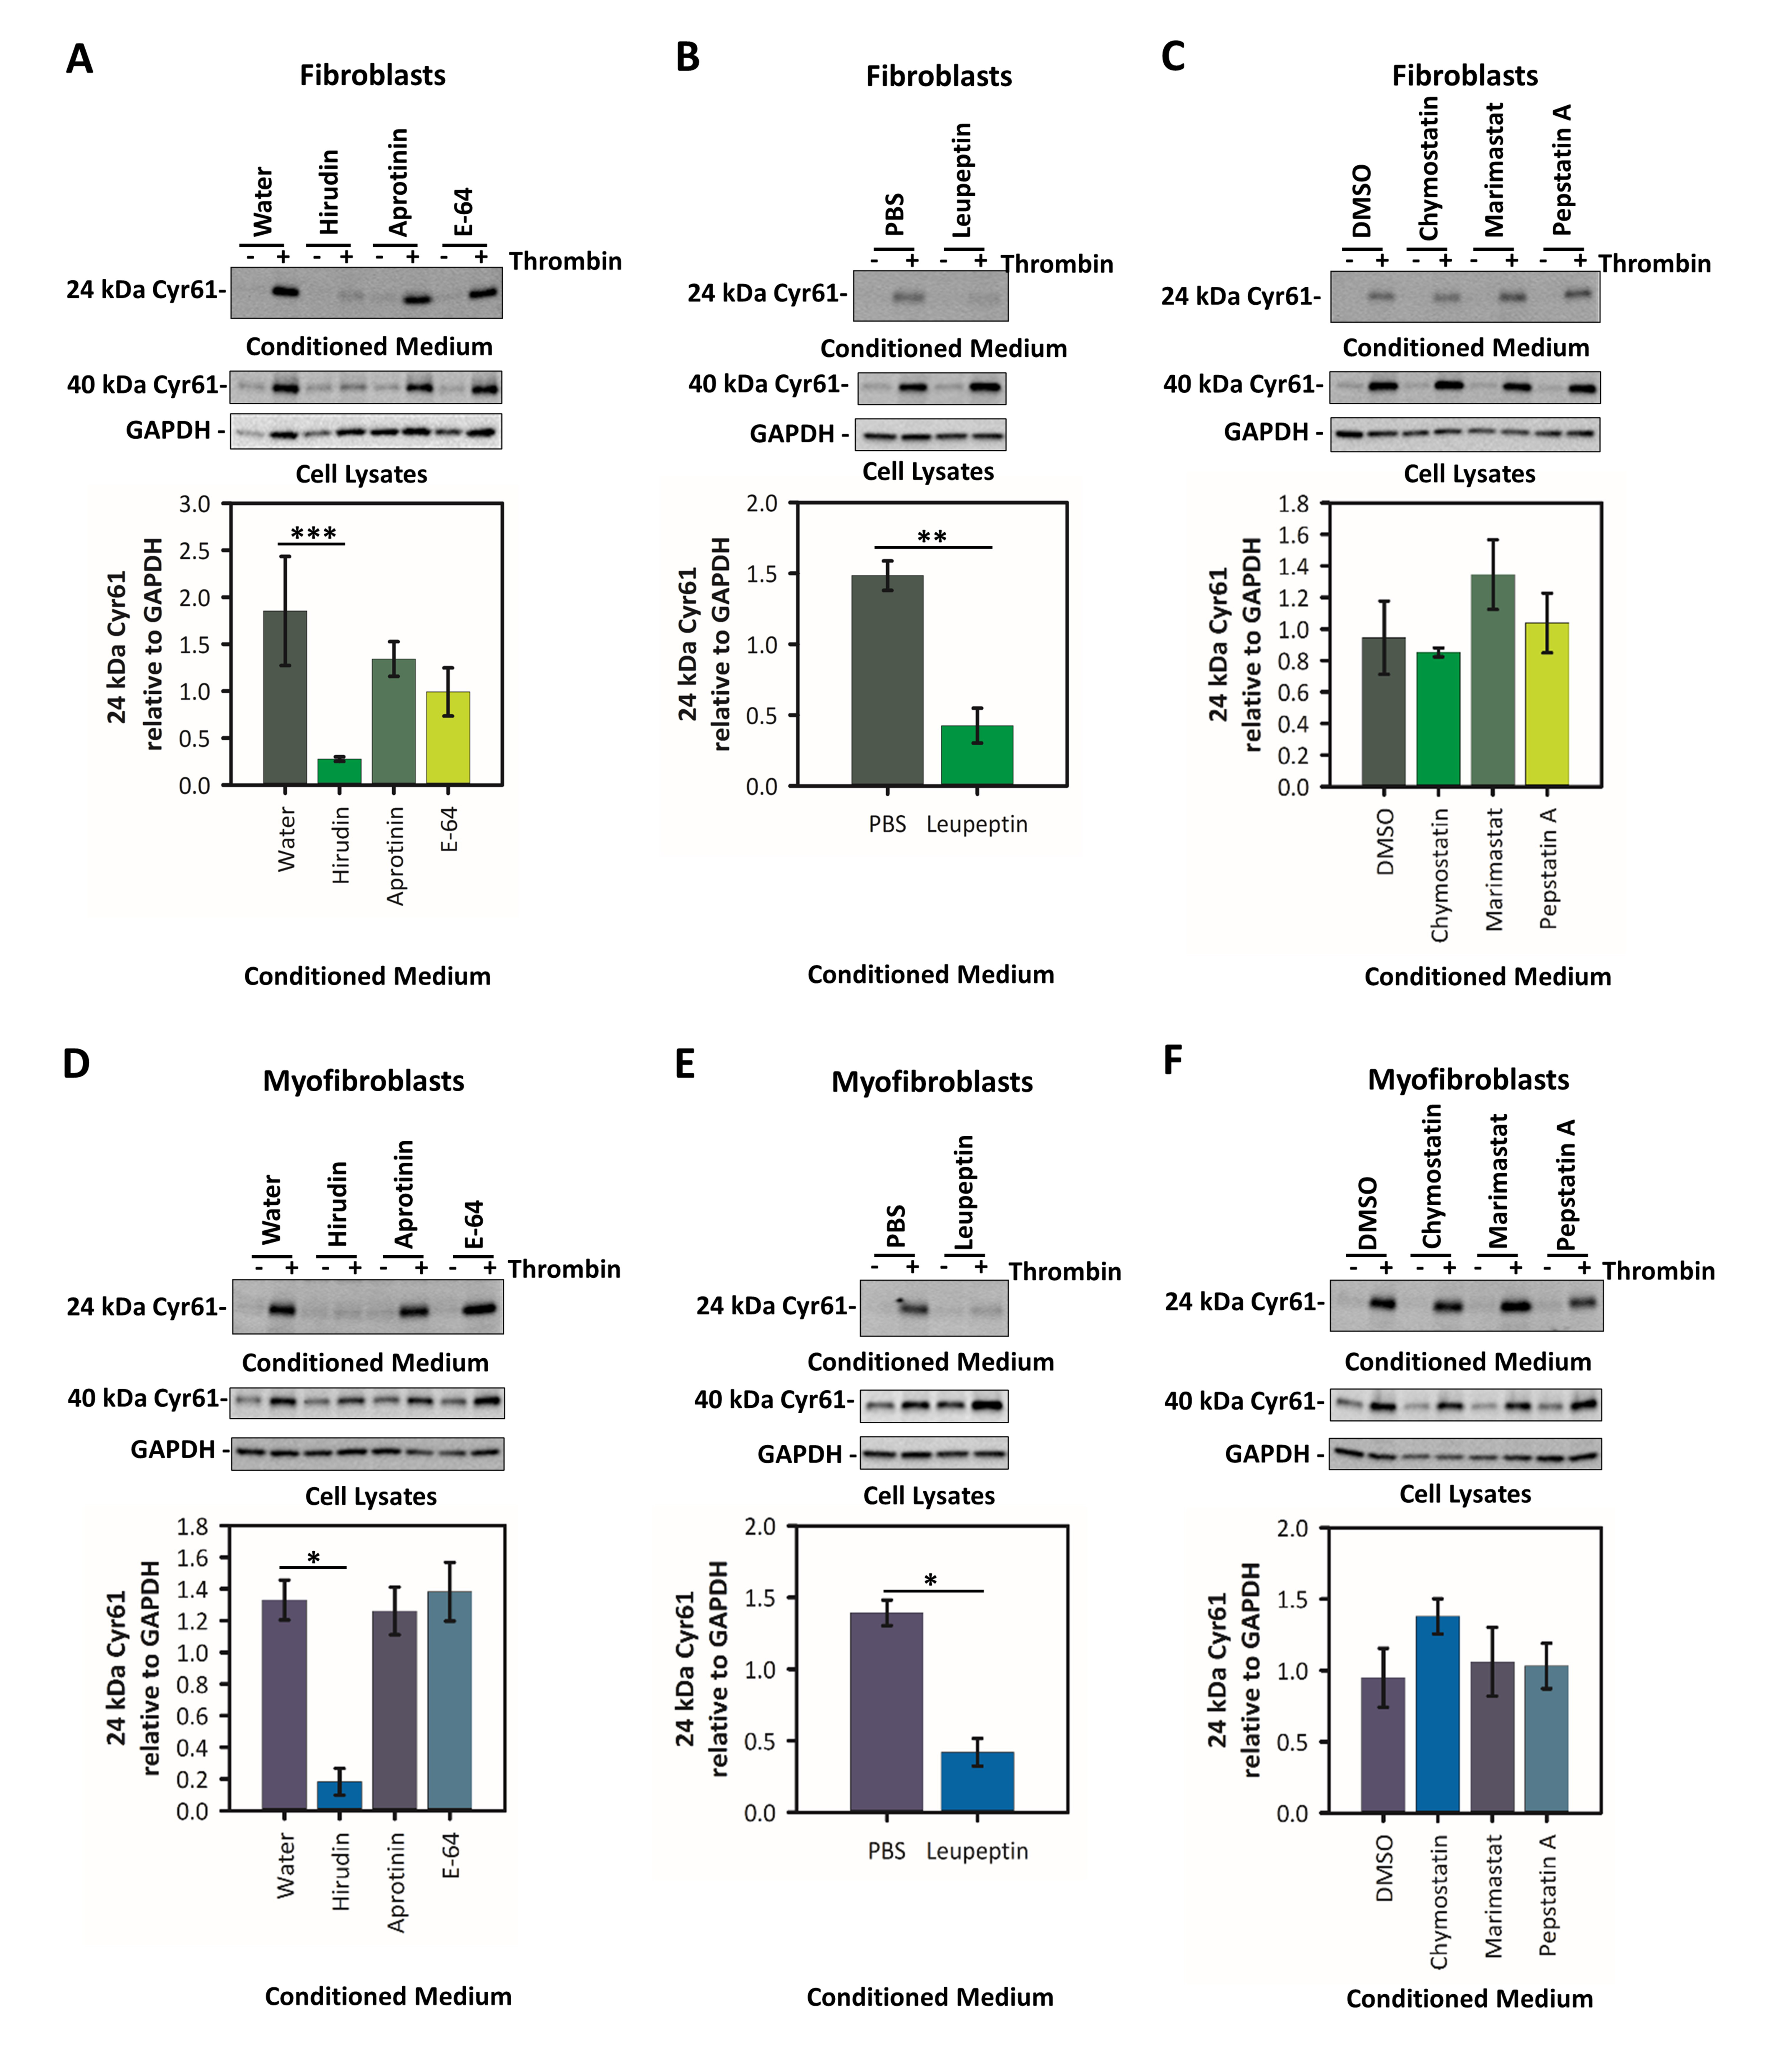
Figure 7. Leupeptin and hirudin inhibit the appearance of the 24 kDa Cyr61 form in the fibroblast and myofibroblast conditioned media.
Human corneal stromal fibroblasts (
A-C) and myofibroblasts (
D-F) were preincubated for at least 5 min with a panel of protease inhibitors (4.4 AT-U/ml hirudin, 0.3 µM aprotinin, 100 μM
leupeptin, 10 µM E-64, 100 µM chymostatin, 10 μM marimastat, 1 µM pepstatin A, or vehicle) before the addition of 1.0 U/ml
thrombin (+) or additional medium (-). Medium or thrombin (1.0 U/ml) was added and the cells were incubated for an additional
3 h. The conditioned media and lysates were collected, processed, and evaluated via western blot analysis for Cyr61 using
an antibody against the central linker region of Cyr61 (
Figure 1D). Band densities for the 24 kDa Cyr61 form produced under differing culture conditions were normalized to GAPDH. These values
were statistically analyzed using a one-way ANOVA or a one-way ANOVA on ranks (Kruskal–Wallis test) for skewed sample distributions.
A one-way analysis was used to compare the effect of the inhibitors in the presence of thrombin because reliable band densities
could not be obtained in the absence of thrombin. For fibroblast sample groups: (
A) Water soluble inhibitors: H: 10.147, df: 3, p = 0.017; n = 4; (
B) PBS soluble inhibitors: F: 43.452, df: 1, 4, p = 0.003; n = 3; (
C) DMSO soluble inhibitors: F: 1.312, df: 3, 8, p = 0.336; n = 3. For myofibroblast sample groups: (
D) Water soluble inhibitors: F: 16.480, df: 3, 12, p<0.001 n = 4; (
E) PBS soluble inhibitors: F: 54.801, df: 1, 4, p = 0.002, n = 3; (
F) DMSO soluble inhibitors: F: 1.011, df: 3, 12, p = 0.422; n = 4. Statistically significant p values per Dunnett’s test are
indicated as *p<0.001, **p<0.002, ***p<0.050 in the figure above the bars. All error bars displayed are SEM. Band densities
analyzed were from at least three independent experiments from different cell donors for each inhibitor type. Representative
blots are shown.
 Figure 7 of
Andreae, Mol Vis 2020; 26:540-562.
Figure 7 of
Andreae, Mol Vis 2020; 26:540-562.