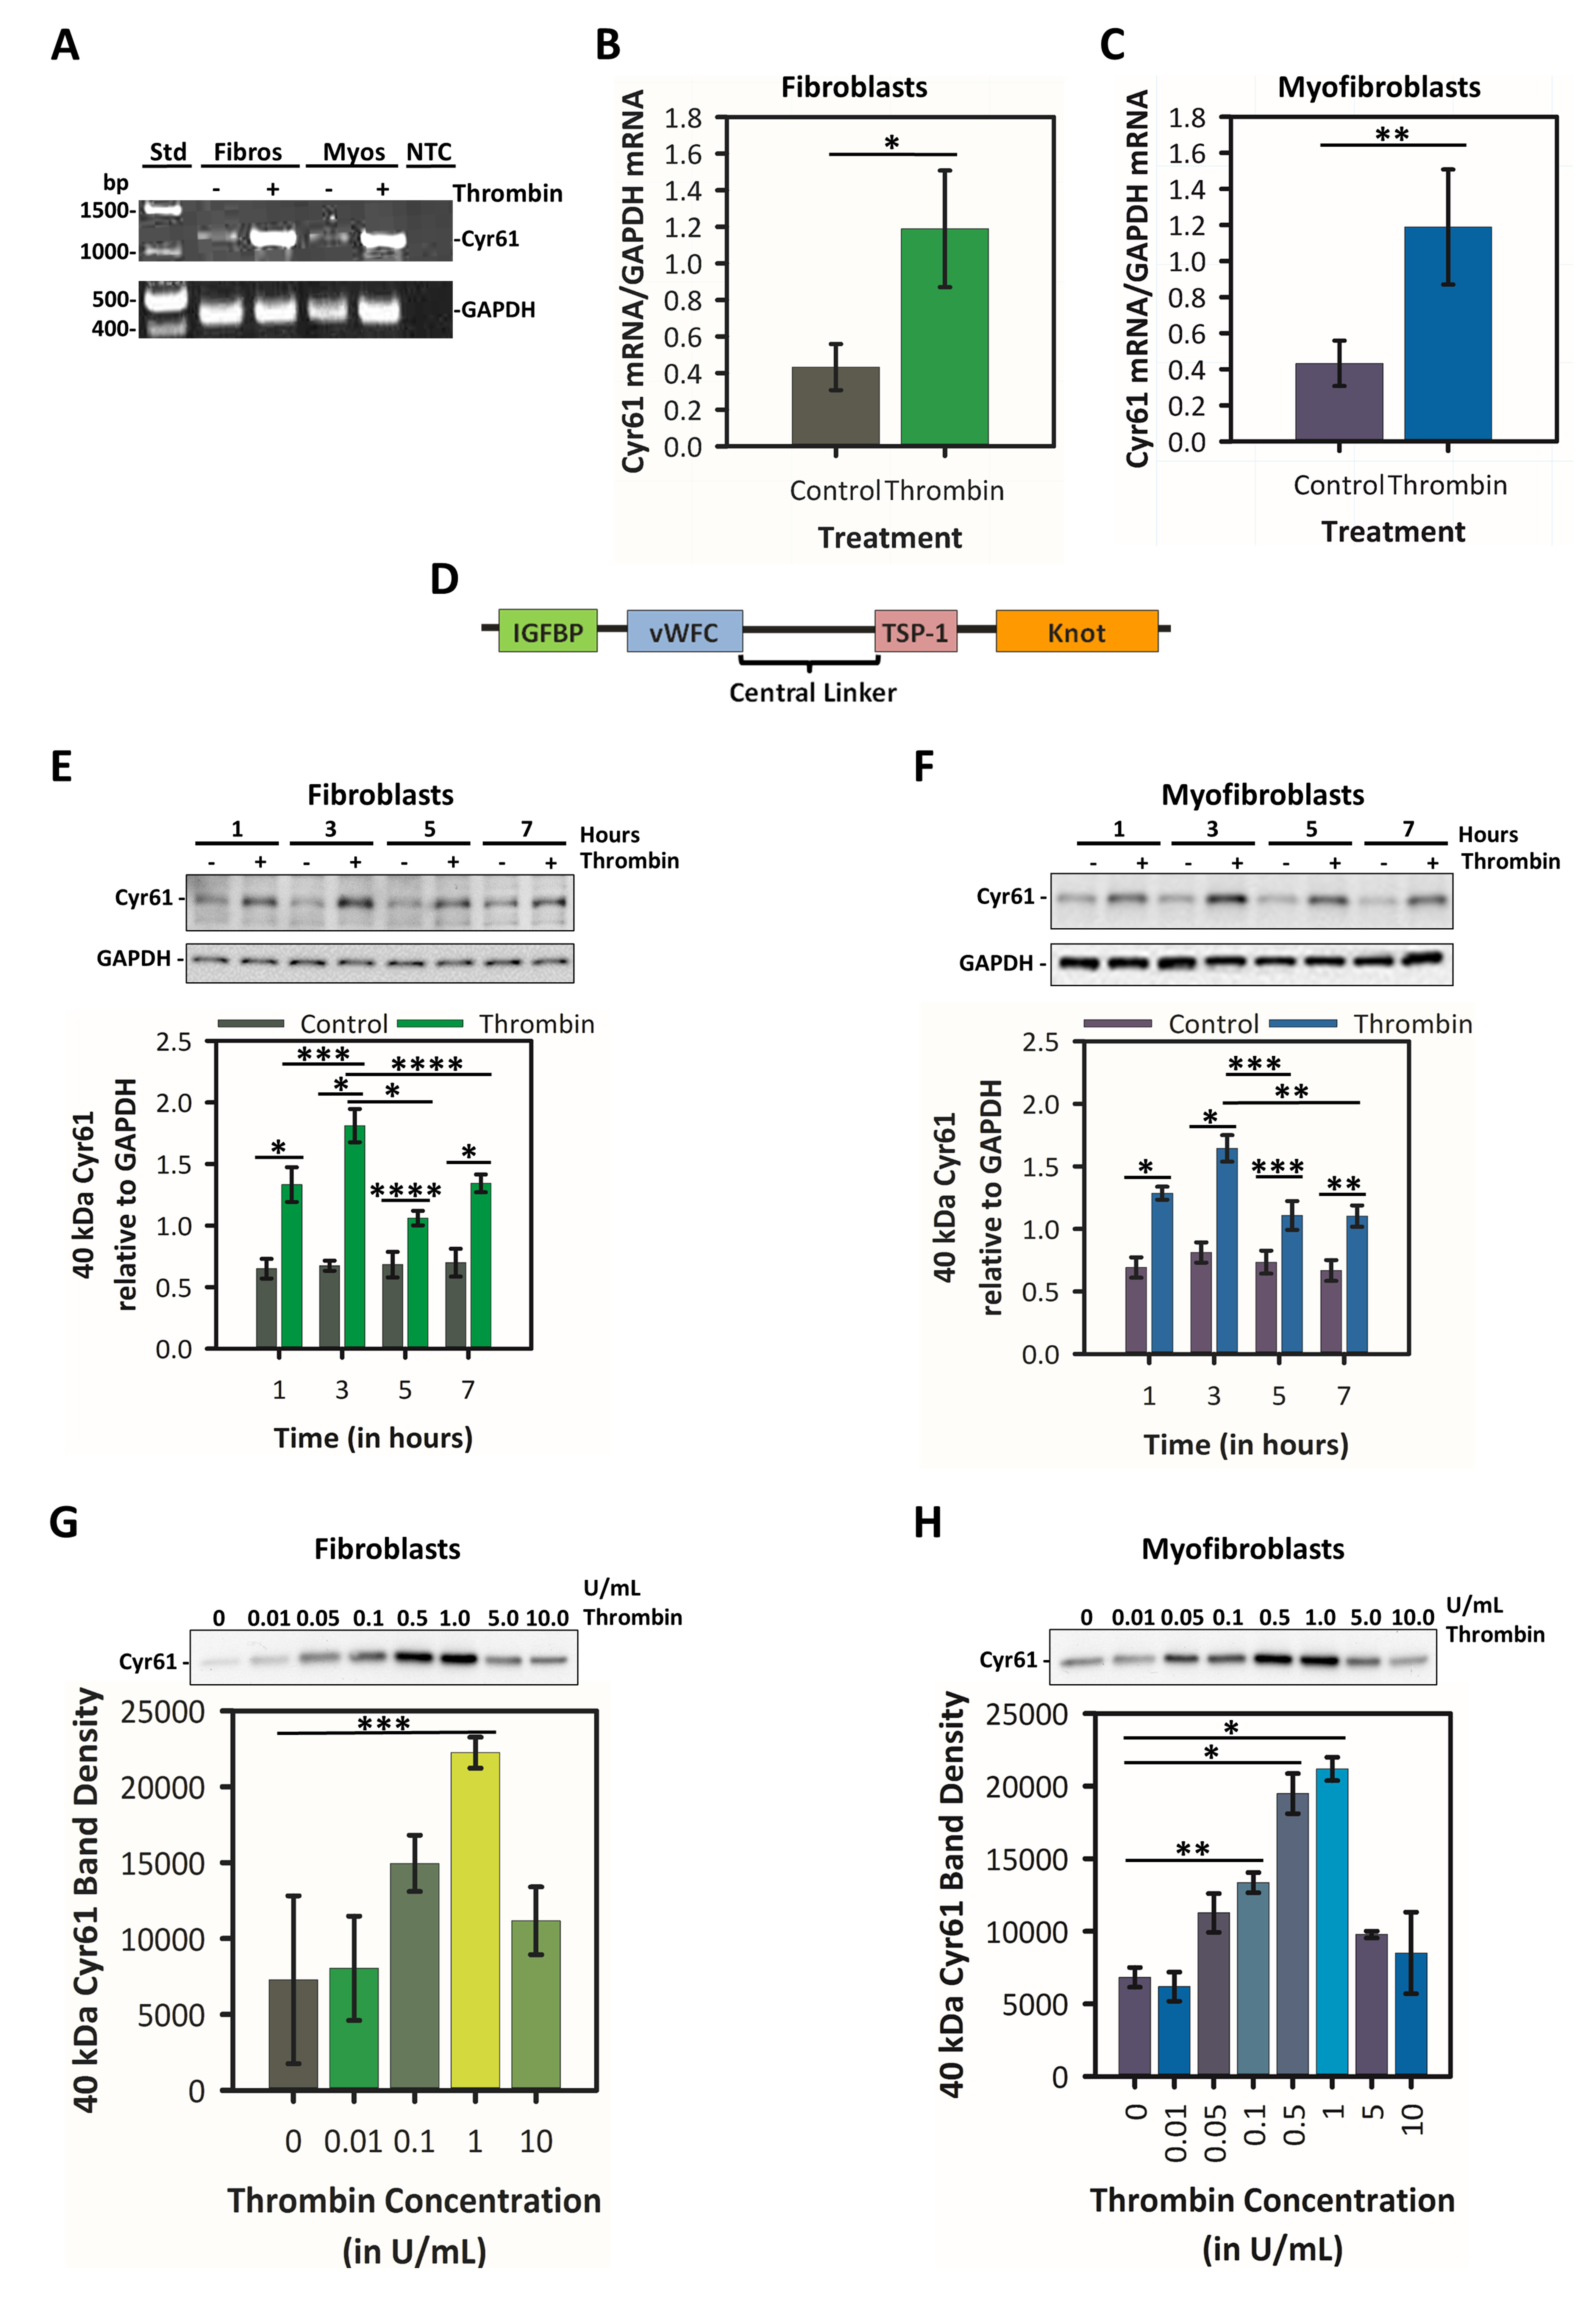
Figure 1. Thrombin increases synthesis of Cyr61 by human corneal stromal fibroblasts and myofibroblasts.
A-C: Human corneal fibroblasts (Fibros) and myofibroblasts (Myos) were incubated with a serum-free medium alone (-) or a serum-free
medium containing 1.0 U/ml thrombin (+) for 60 min. Alterations in the Cyr61 mRNA levels were detected using agarose gels
(
A) to visualize the reverse transcriptase-PCR (RT–PCR) products of primers in exons 1 and 5 (
Table 1) and were quantified by real-time PCR using primers in exons 2 and 3 (
Table 1). GAPDH was used for the normalization. Controls were negative. For both types of experiments, n = 4 using cells from individual
donors. A representative gel is given in
A. The real-time PCR data (
B,
C) were analyzed with a one-tailed Student
t test. Fibroblasts: t = -2.271, df = 14, *p = 0.020, n = 8; myofibroblasts: t = -2.205, df = 10, **p = 0.026, n = 6. Error
bars represent standard error of means (SEM).
D: Location of the epitope for the central linker region-specific Cyr61 polyclonal antibody used in
E-
H.
E-
H: Fibroblasts (
E,
G) and myofibroblasts (
F,
H) were incubated in a serum-free medium from 1-7 h with (+) or without (-) thrombin (1.0 U/ml) for
E and
F. For
G and
H, the cells were incubated in a serum-free medium (Control) or thrombin (0.01 to 10 U/ml) for 3 h. Cell lysates were collected,
processed, and evaluated for Cyr61 via western blot analysis. GAPDH was used as the loading control in
E and
F and the modified Bradford Coomassie assay was used for
G and
H. These methods gave equivalent results. Representative blots are shown with corresponding mean band densities from independent
experiments (
E,
F: n = 5 and
G,
H: n = 3) of different cell donors.
E,
F: The two-way ANOVA for Time: F = 4.872, df = 3, 32, p = 0.007 for fibroblasts, and F = 6.042, df = 3, 32, p = 0.002 for fibroblasts;
for Treatment: F = 102.569, df = 1, 32, p<0.001 for fibroblasts and F = 79.511, df = 1, 32, p<0.001, n = 5 for myofibroblasts,
and the Time and Treatment Interaction factor for fibroblasts: F = 5.051, df = 3, 32, p = 0.006, n = 5 and for myofibroblasts:
F = 2.658, df = 3, 32, p = 0.065, n = 5. Significant Tukey multiple pairwise comparisons are *p<0.001, **p<0.005, ***p<0.010,
****p = 0.011. Error bars displayed are SEM.
G,
H: One-way ANOVA for fibroblasts: F = 3.605, df = 4, 10, p = 0.046, n = 3 and for myofibroblasts: F = 17.669, df = 7, 16, p<0.001,
n = 3. Significant Dunnett’s multiple pairwise comparisons are *p<0.001, **p = 0.017, ***p = 0.026. Error bars displayed are
SEM.
 Figure 1 of
Andreae, Mol Vis 2020; 26:540-562.
Figure 1 of
Andreae, Mol Vis 2020; 26:540-562.