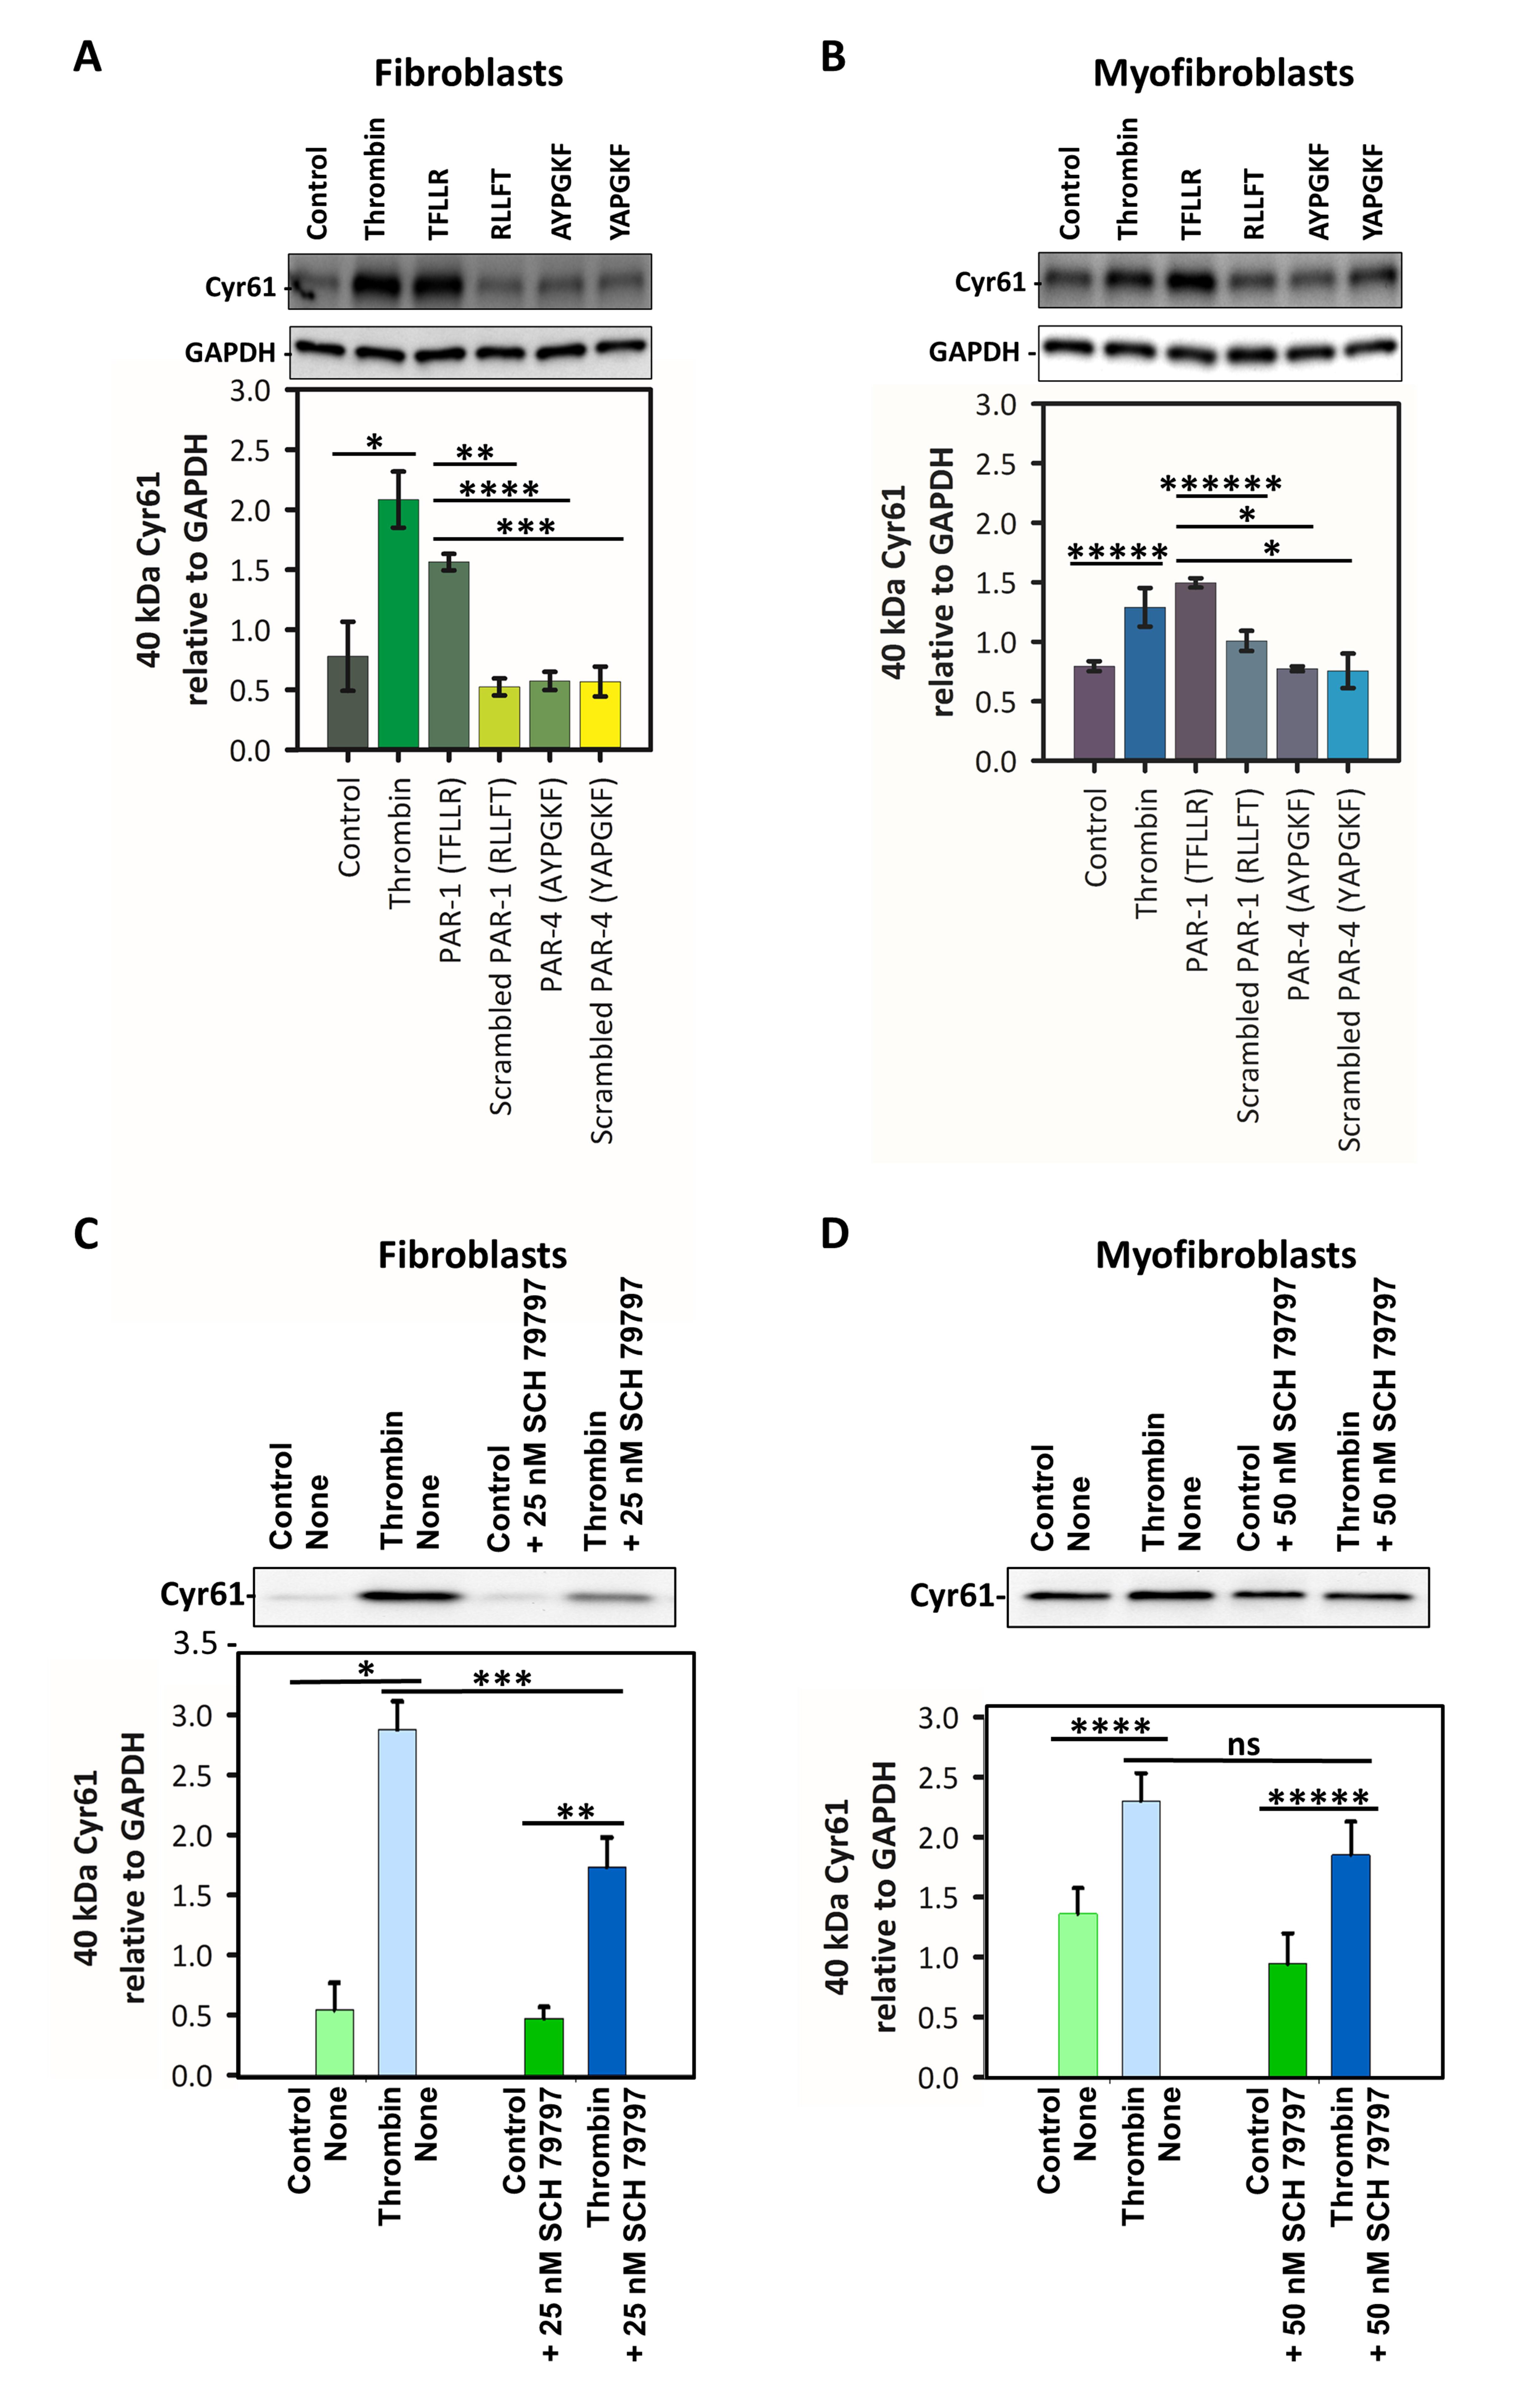
Figure 3. PAR-1 agonist increases the cell-associated Cyr61 protein levels in human corneal stromal fibroblasts and myofibroblasts,
and PAR-1 antagonist decreases the thrombin stimulated increase of Cyr61 in human corneal stromal fibroblasts.
A and
B: Fibroblasts (
A) and myofibroblasts (
B) were treated with control (a serum-free medium alone), thrombin (1.0 U/ml as a positive control), 111 μM PAR-1 or PAR-4
agonist peptides (TFLLR and AYPGKF, respectively), or 111 μM scrambled PAR-1 or PAR-4 agonist peptides (RLLFT and YAPGKF,
respectively) for 1 h. Cell lysates were collected and evaluated via western blot analysis for Cyr61 using a specific antibody
to the central linker region of Cyr61 (
Figure 1D); representative blots are shown. GAPDH normalized Cyr61 band densities were calculated for fibroblasts and myofibroblasts,
respectively, and analyzed using a one-way ANOVA: F = 15.183, df = 5, 12, p<0.001, n = 3 for fibroblasts and F = 9.928, df
= 5, 12, p<0.001, n = 3 for myofibroblasts. Tukey pairwise multiple comparisons are denoted as *p = 0.002, **p = 0.009, ***p
= 0.012, ****p = 0.013. *****p = 0.030, ******p = 0.039; n = 3 independent experiments using different cell donors. Error
bars displayed are SEM.
C and
D: Fibroblasts (
C) and myofibroblasts (
D) were treated with a serum-free medium alone (Control, None), a medium containing 1.0 U/ml thrombin (Thrombin, None), a medium
containing a PAR-1 antagonist, SCH 79797, at 25 nM for fibroblasts (
C, Control + 25 nM SCH 79797) and 50 nM SCH 79797 for myofibroblasts (
D, Control + 50 nM SCH 79797), or a medium containing 1.0 U/ml thrombin and 25 nM SCH 79797 (
C, Thrombin + 25 nM SCH 79797) for fibroblasts and 50 nM SCH 79797 for myofibroblasts (
D, Thrombin + 50 nM SCH 79797) for 3 h. Representative blots are shown. Protein normalized Cyr61 band densities were calculated
and analyzed. For fibroblasts, the two-way ANOVA results are: Treatment: F = 75.540, df = 1, 8, p<0.001; Inhibitor: F = 8.650,
df = 1, 8, p = 0.019; Interaction between Treatment and Inhibitor: F = 6.733, df = 1, 8, p = 0.032. For myofibroblasts, the
two-way ANOVA results are: Treatment: F = 6.280, df = 1, 8, p = 0.037; Inhibitor: F = 0.00104, df = 1, 8, p = 0.975; Interaction
between Treatment and Inhibitor: F = 0.0185, df = 1, 8, p = 0.895. Significant Tukey pairwise multiple comparison are denoted
as *p<0.001, **p = 0.003, ***p = 0.005, ****p = 0.026, *****p = 0.030 and non-significant as ns; n = 3 independent experiments
using different cell donors. Error bars displayed are SEM.
 Figure 3 of
Andreae, Mol Vis 2020; 26:540-562.
Figure 3 of
Andreae, Mol Vis 2020; 26:540-562.