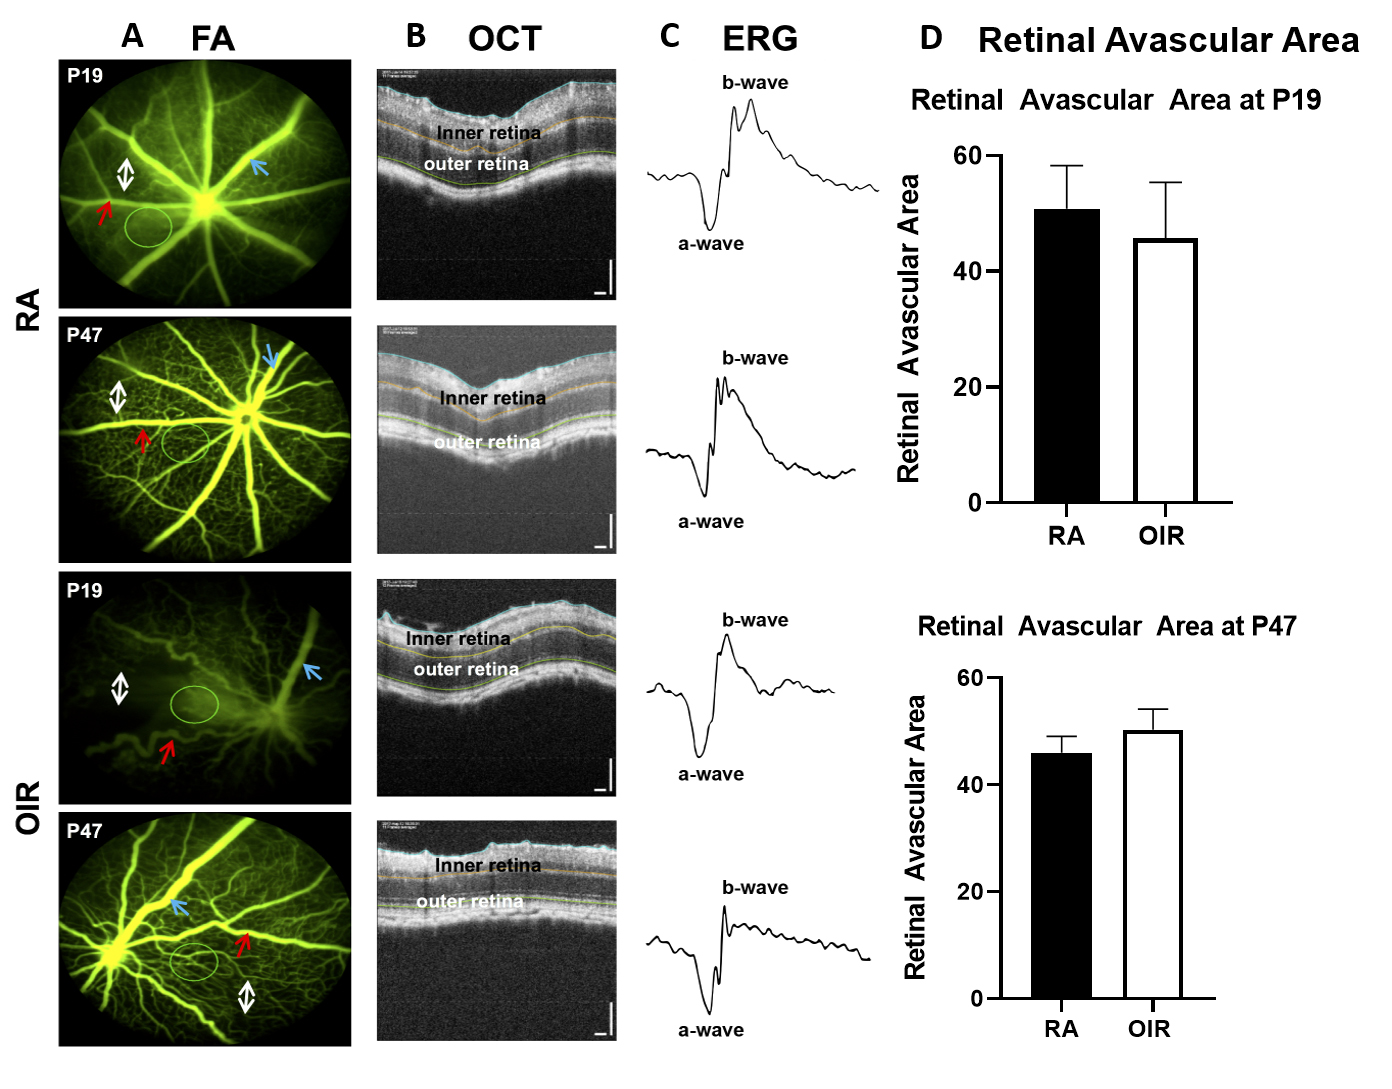
Figure 1. In vivo imaging in RA and OIR mice.
A: Representative fluorescein angiography, FA, at P19 and P47 in RA and OIR mice. FA shows uniform capillaries, veins, and
arteries in the RA mice. FA shows the avascular capillary network in the OIR mice compared to the RA mice at P19, and a persistent
sparse capillary network in the OIR mice compared to the RA mice at P47. The capillary network (white double arrow) is dense
in the RA mice and sparse in the OIR mice. There are dilated veins and tortuous arteries in the OIR mice, and veins (blue
arrows) and arteries (red arrows). Green circles in the FA images indicate the region of interest (ROI) where electroretinogram
(ERG) and spectral domain optical coherence tomography (SD-OCT) measurements were obtained.
B: Representative SD-OCT shows a thinner inner retina in the OIR mice compared to the RA mice at P19 and P47.
C: Representative ERGs at P19 and P47 in the RA and OIR mice. The ERG shows a decrease in the b-wave amplitude at P47 in the
OIR mice compared to the RA mice.
D: Quantification of the retinal avascular area. The retinal avascular area (empty spaces in between capillaries and major
vessels in the RA and OIR mice) was quantified as a percentage (%) of the total retinal area, using an automated
MATLAB program, as previously published [
22]. Although the OIR phenotype showed capillarity avascularity at P19 and sparsity at P47, the quantification of the retinal
avascular area from the FA images in
Figure 1A did not show a statistically significant difference between RA and OIR mice at P19 (50.83 ± 3.040% versus 45.8 ± 4.28%, p>0.05,
n = 6), but showed a trend toward more avascularity in the OIR mice at P47 (46.00 ± 1.270% versus 50.33 ± 1.570%, p = 0.0566,
n = 6). Representative images of simultaneous FA, SD-OCT, and ERG are shown in
Figures 1A–C. RA = room air; OIR = oxygen-induced ischemic retinopathy; P = postnatal day. Six RA mice and six OIR mice were examined
for each developmental age studied. A p value of less than 0.05 was considered statistically significant.
 Figure 1 of
Mezu-Ndubuisi, Mol Vis 2020; 26:257-276.
Figure 1 of
Mezu-Ndubuisi, Mol Vis 2020; 26:257-276.