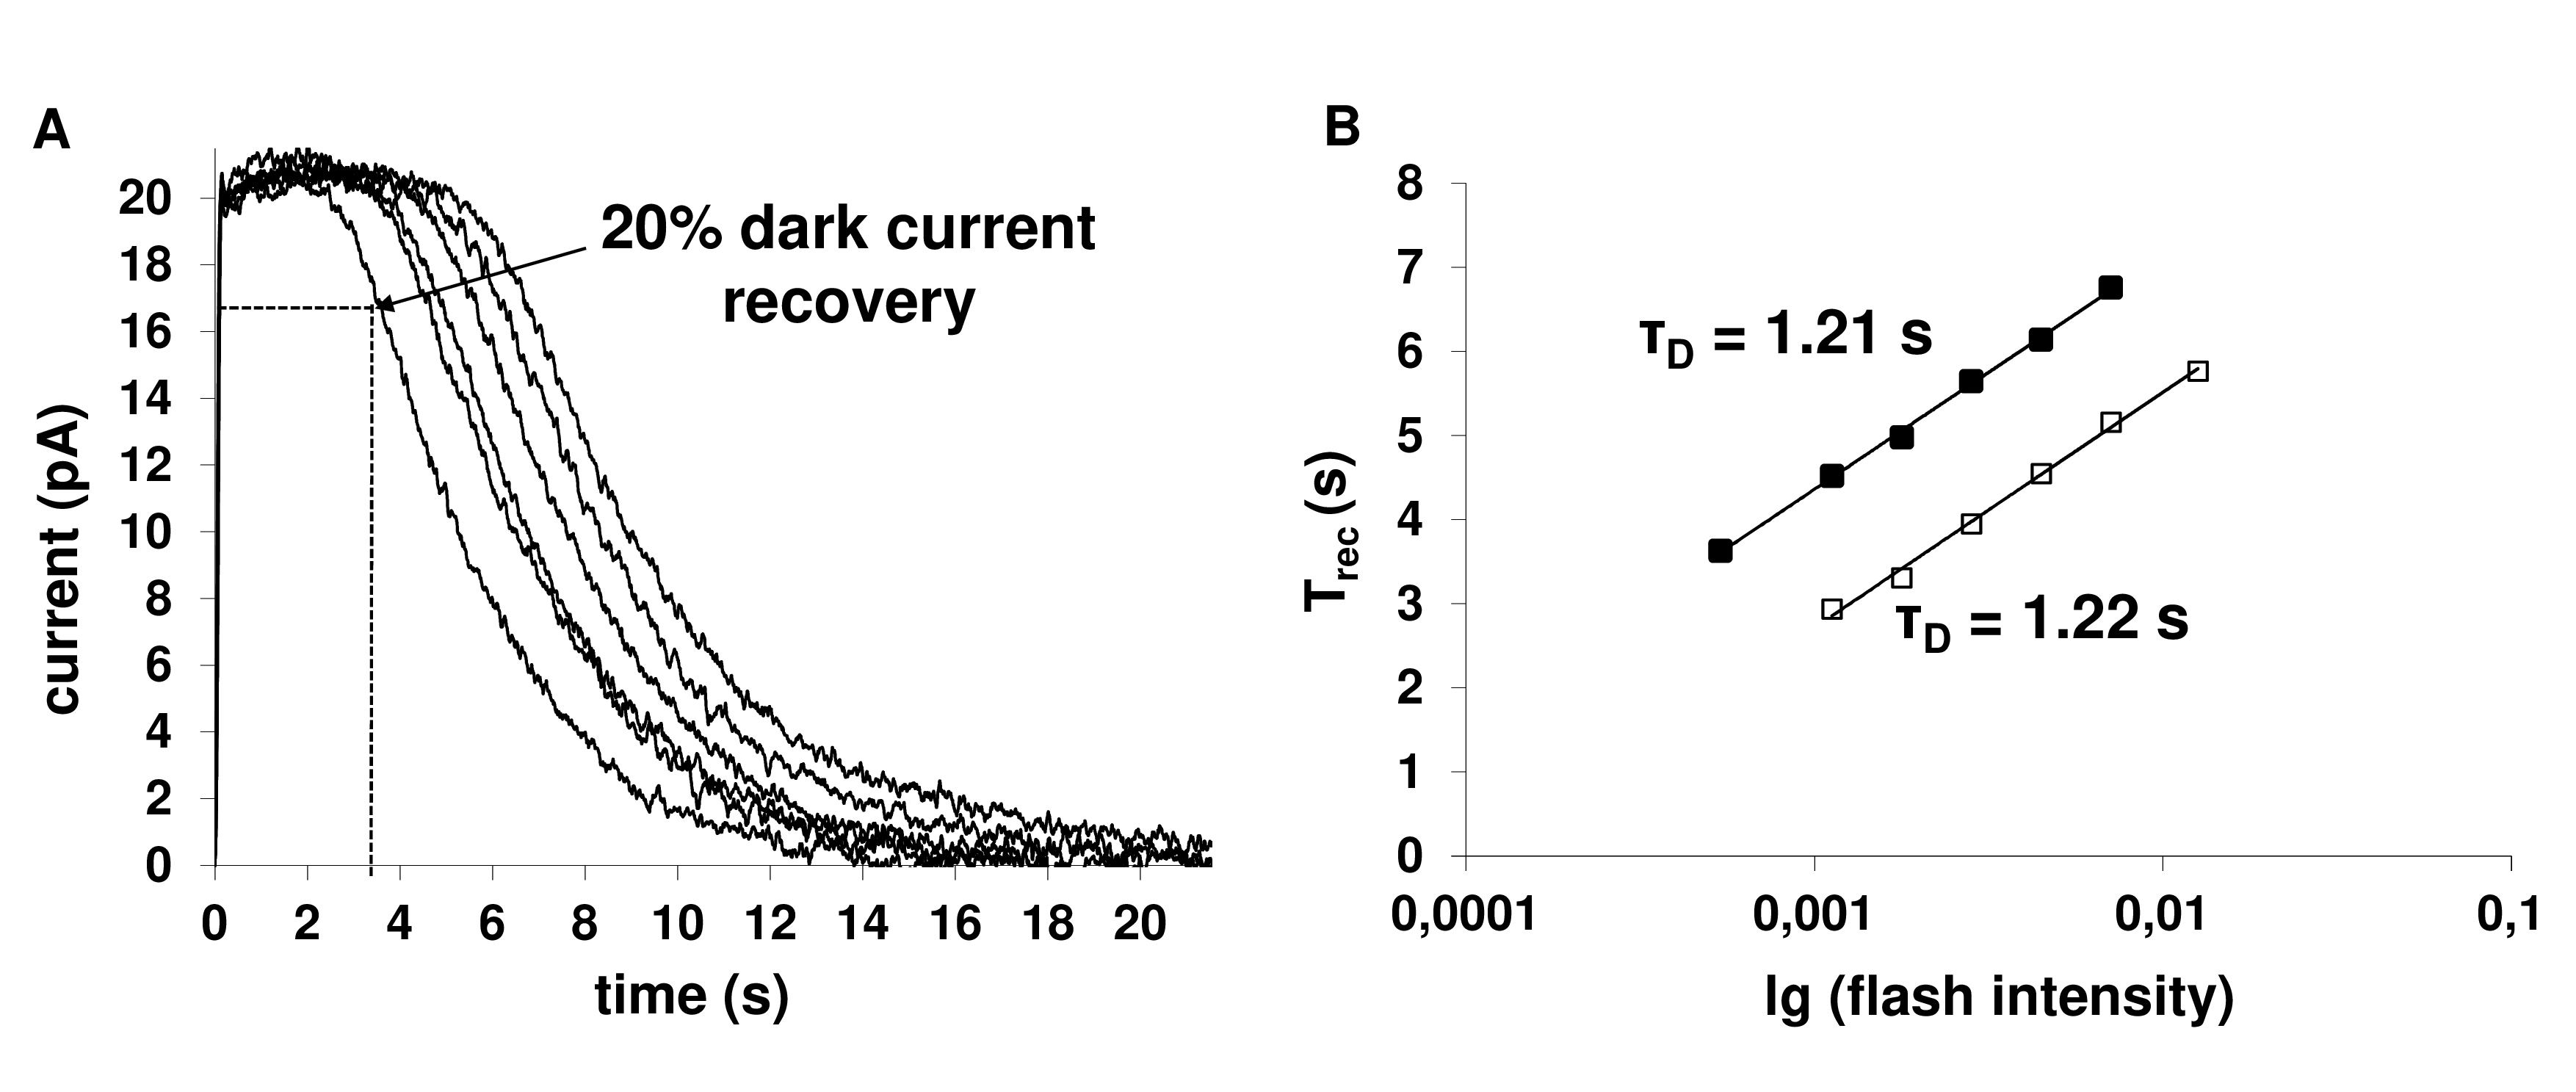
Figure 3. Determining the dominant time constant of recovery of rods from saturating flashes.
A: The set of responses to saturating stimuli of increasing flash intensities was recorded in Ringer’s solution. The same set
of responses was recorded after 20 min from the start of dopamine perfusion (data not shown). The flash intensities in these
records were 153–3,431 photons ・μm
−2 per flash.
B: Plotting the time of recovery from saturation (T
rec) as a function of the flash intensity in log scale in Ringer’s solution (■) and after 20 min of incubation in 2.5-µM dopamine-containing
solution (□). The straight lines approximate experimental points with T
rec = C + τDˑln(I). T
rec is defined as the time of regaining 20% of the dark current (see
Figure 3A). The dominant recovery time constants (τ
D) are shown near the lines.
 Figure 3 of
Nikolaeva, Mol Vis 2019; 25:400-414.
Figure 3 of
Nikolaeva, Mol Vis 2019; 25:400-414.