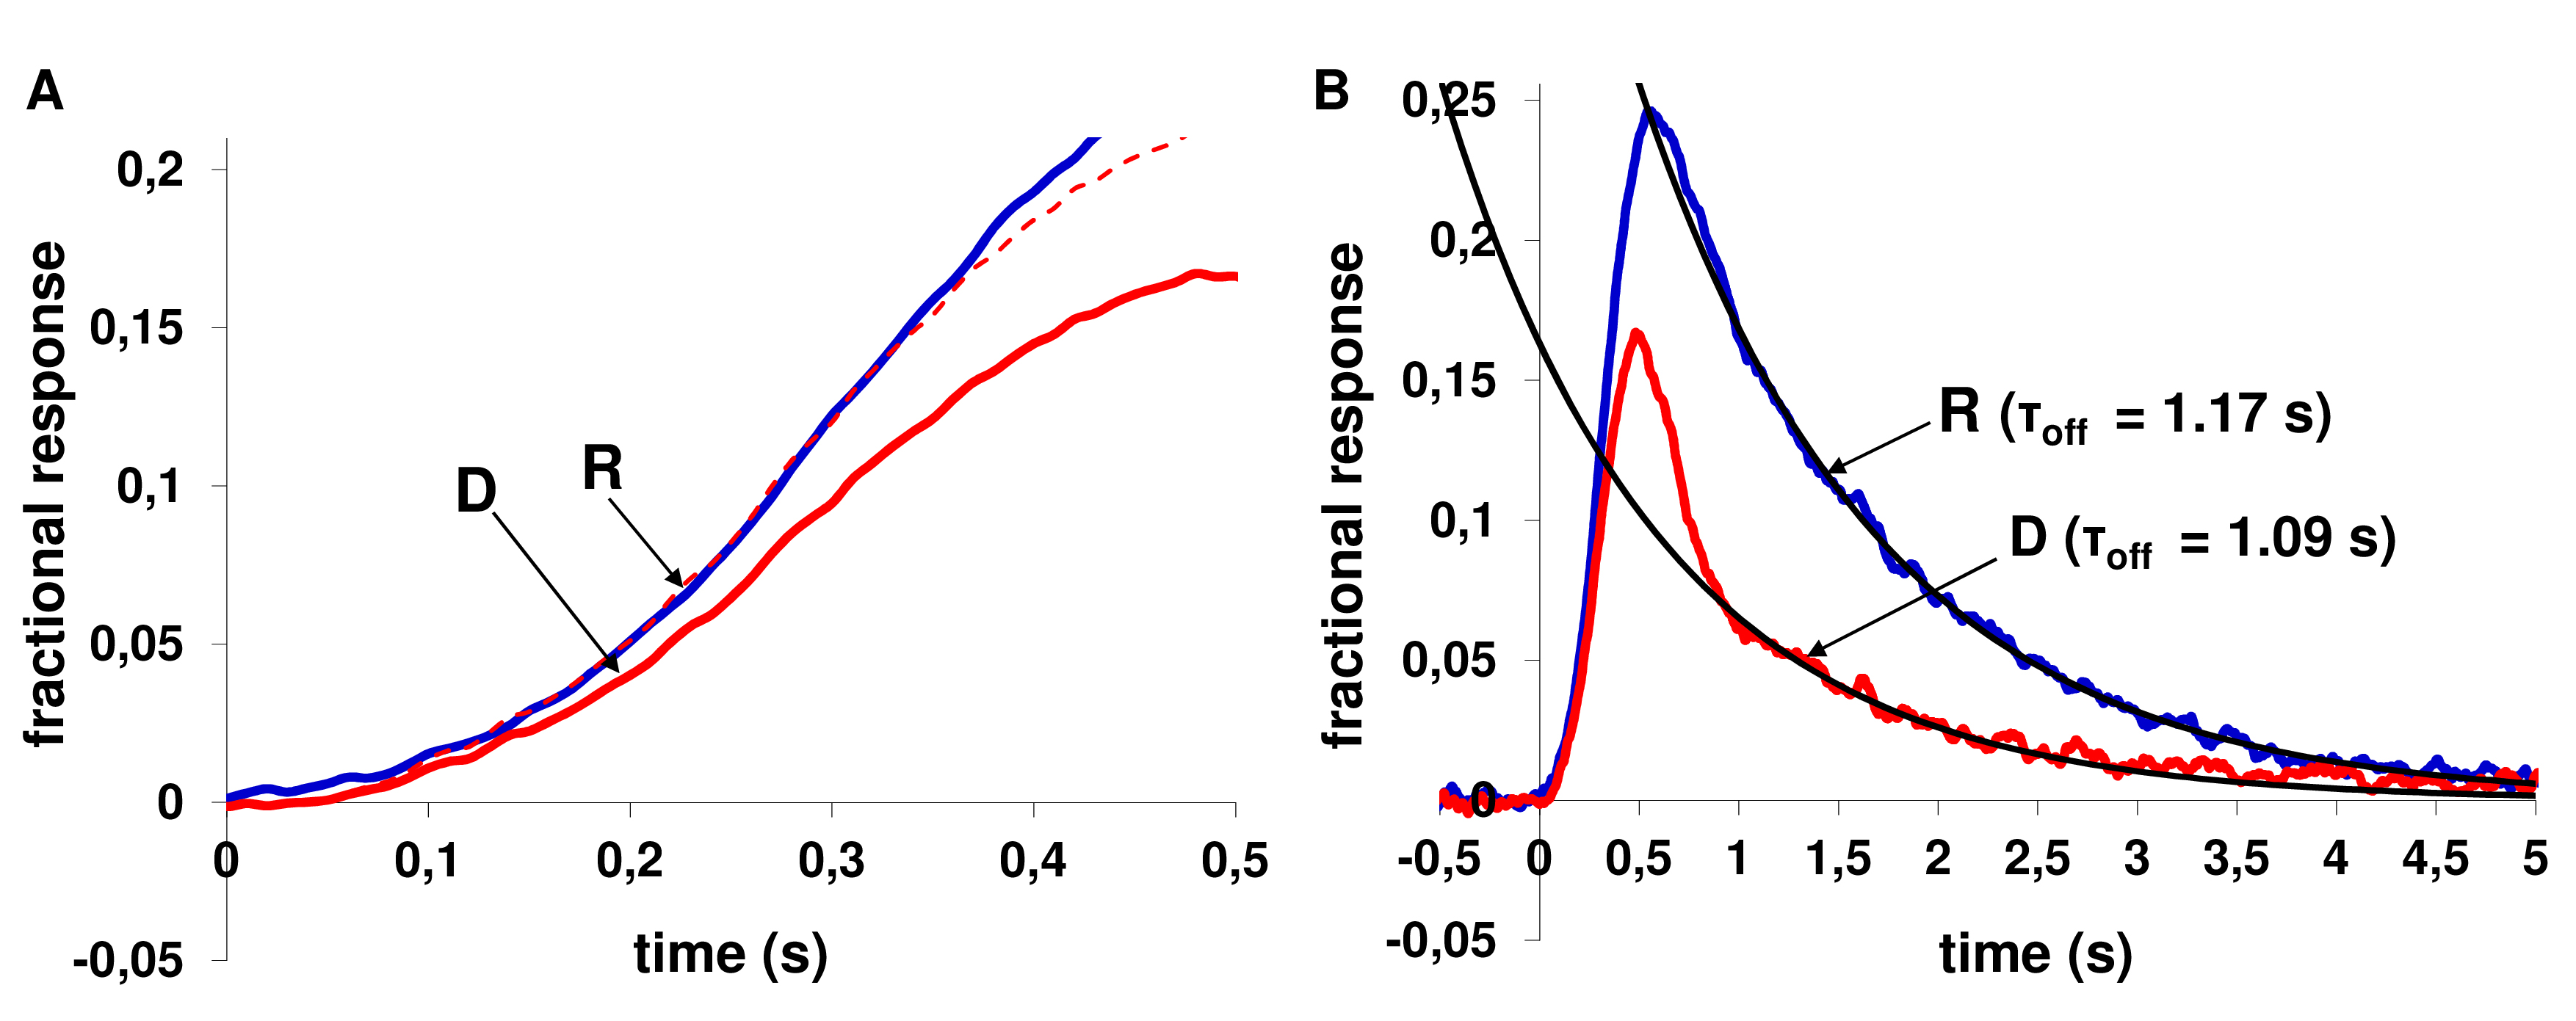
Figure 2. Procedure for determining kinetics of the rising and falling phases of rod photoresponses to weak light flashes (the same
cell as in
Figure 1A).
A: The rising phase of fractional responses recorded in Ringer’s solution (blue solid line, labeled “R”) and in the presence
of 50-µM dopamine (red solid line, labeled “D”) after 20 min of exposure. The red dashed line shows the response in dopamine-containing
solution scaled up by a factor of 1.27 to coincide with the response in Ringer’s solution.
B: A single-exponential fit of the falling phase of fractional responses in Ringer’ solution (blue solid line, labeled “R”)
and after 20 min incubation in 50-µM dopamine-containing solution (red solid line, labeled “D”). The turn-off time constants
(τ
off) are shown near the curves of photoresponses.
 Figure 2 of
Nikolaeva, Mol Vis 2019; 25:400-414.
Figure 2 of
Nikolaeva, Mol Vis 2019; 25:400-414.