Figure 1. Effect of dopamine on the light sensitivity of frog rods in the “outer segment out” configuration. A: Fractional responses of a frog rod in Ringer’s solution (blue solid line, labeled “R”) just before the start of dopamine
application and after 20 min of exposure to 50-µM dopamine-containing solution (red solid line, labeled “D”). Each trace is
an average of 10 responses. The responses were normalized to a magnitude of the corresponding dark current that was 22.5 pA
in Ringer’s solution and 21 pA at the end of perfusion with dopamine. The flash intensity in these records was 0.81 photon
・μm−2 per flash. B: Changes of the sensitivity presented as a ratio of fractional photoresponses after 20 min of incubation in dopamine-containing
solution to fractional photoresponses in Ringer’s solution. Control data are depicted as a ratio of fractional photoresponses
after turning on a jet of drug-free Ringer’s solution to fractional photoresponses before introducing rods into the jet. Average
from 7–12 cells in each group. Error bars represent the standard error of the mean (SEM); * denotes p<0.05 versus control.
The significance of differences between different concentrations of dopamine is indicated by connecting lines between bars;
# denotes p<0.05 between concentrations of dopamine.
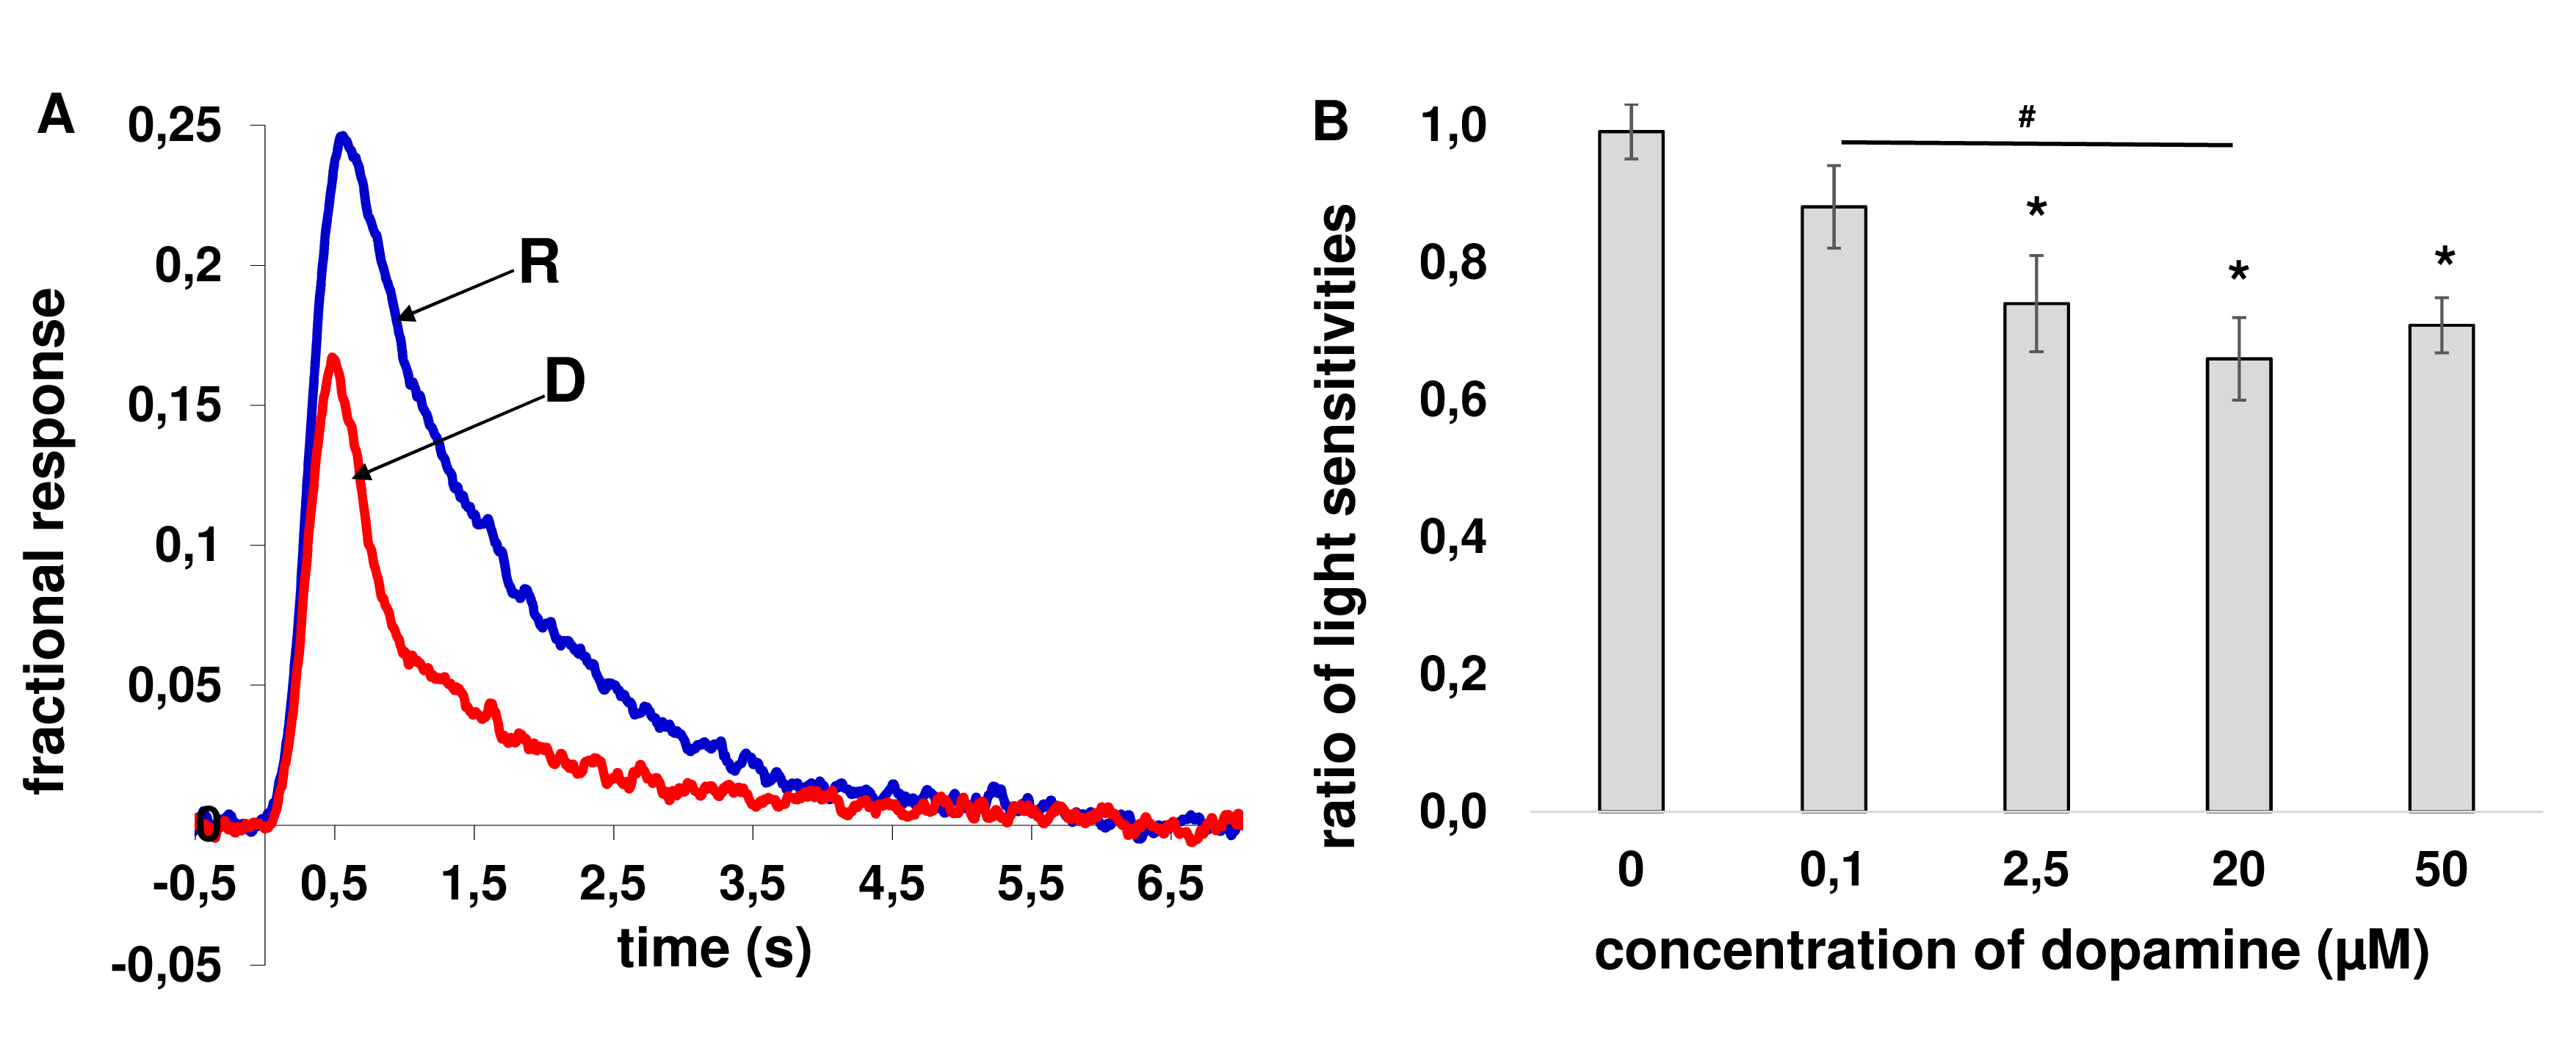
 Figure 1 of
Nikolaeva, Mol Vis 2019; 25:400-414.
Figure 1 of
Nikolaeva, Mol Vis 2019; 25:400-414.