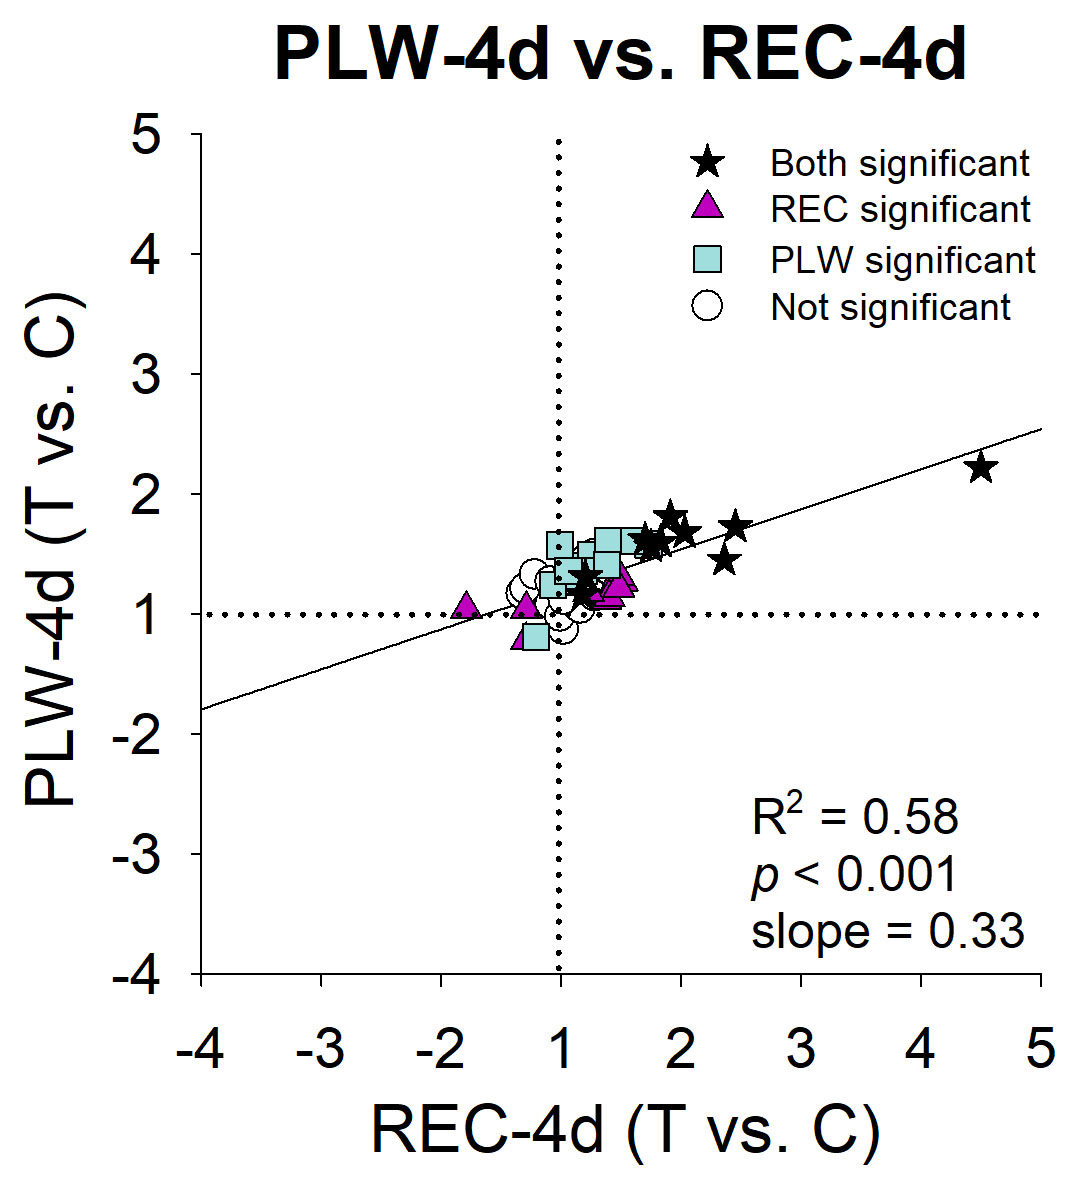
Figure 8. Comparison of the treated eye versus control eye gene expression differences in PLW and REC: PLW-4d (
Figure 6D) versus REC-4d (
Figure 3D). Stars = fold differences statistically significant for both treatments, triangles = fold differences statistically significant
only for the Recovery (REC) group, squares = fold differences statistically significant only for the plus-lens wear (PLW)
group, circles = fold differences not statistically significant for either treatment.
 Figure 8 of
Guo, Mol Vis 2019; 25:311-328.
Figure 8 of
Guo, Mol Vis 2019; 25:311-328.