Figure 3. Gene expression fold differences (treated eyes versus control eyes). A: Recovery for 0 h (REC-0). B: Recovery for 2 h. C: Recovery for 1 day. D: Recovery for 4 days. Filled bars represent statistically significant differences between the treated and control eyes (p<0.05).
The bar color is arbitrary, and is intended to help in comparing the same gene in the different conditions. Error bars = standard
error of the mean (SEM).
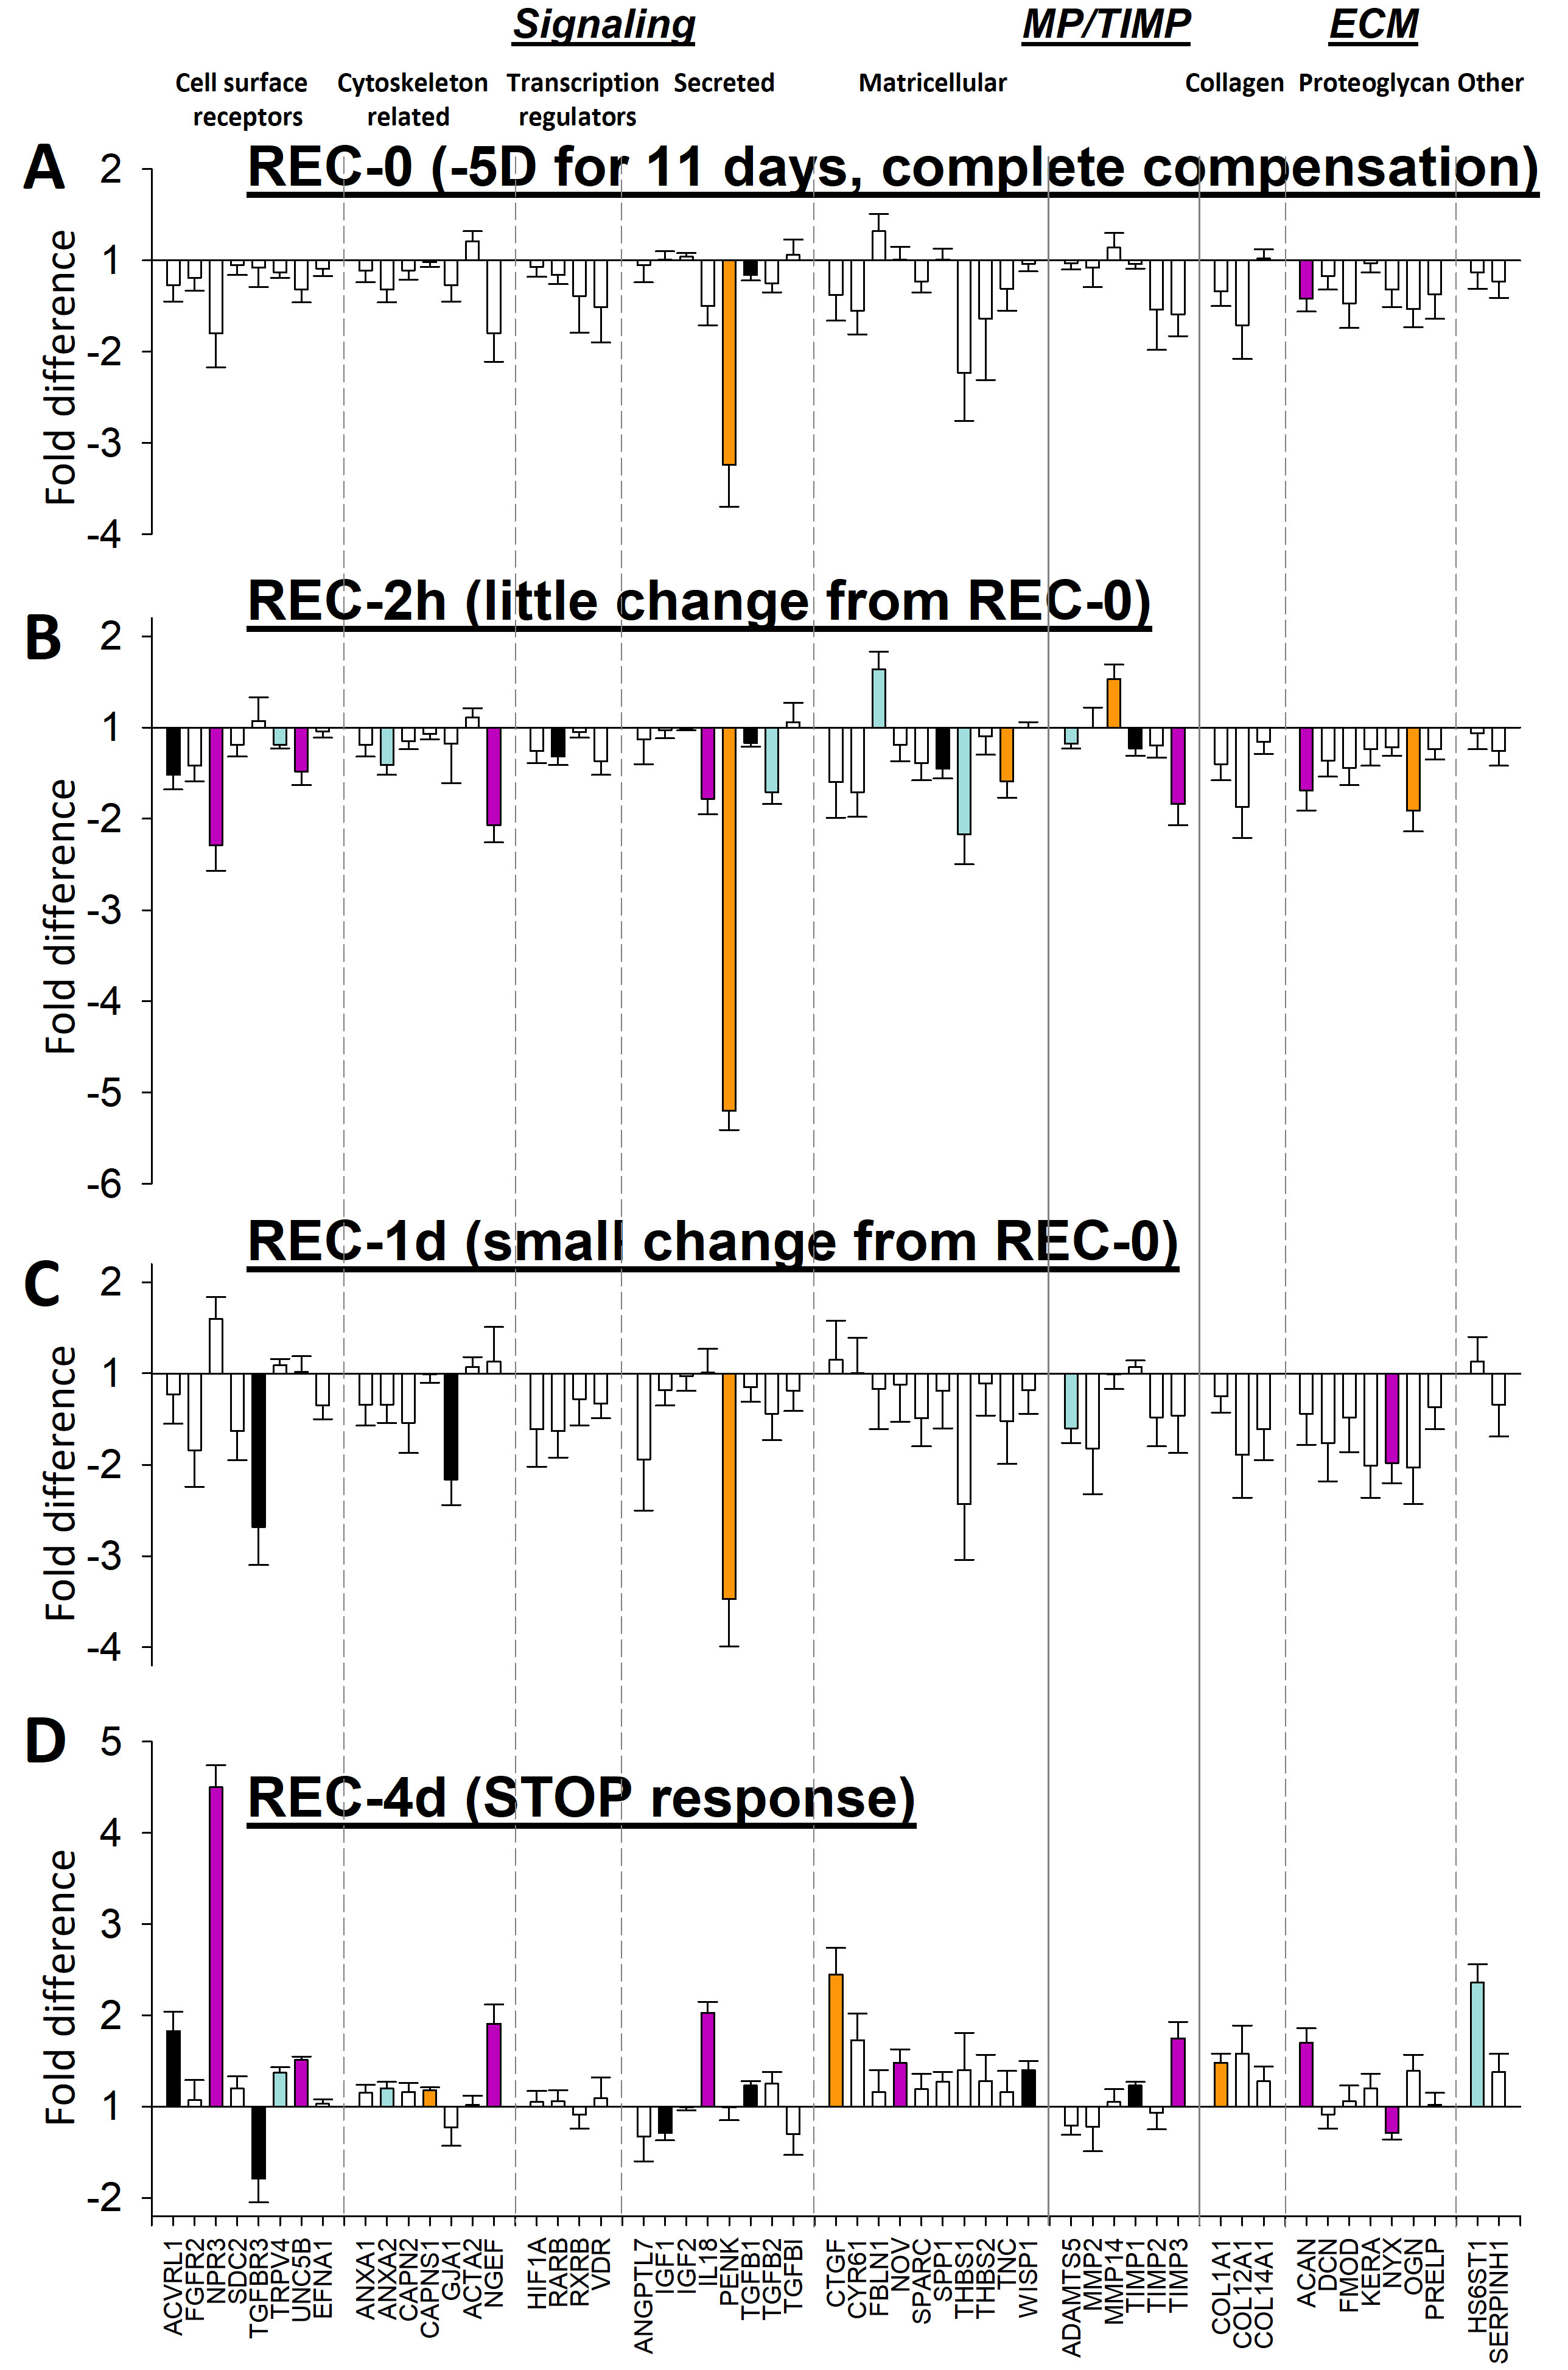
 Figure 3 of
Guo, Mol Vis 2019; 25:311-328.
Figure 3 of
Guo, Mol Vis 2019; 25:311-328.