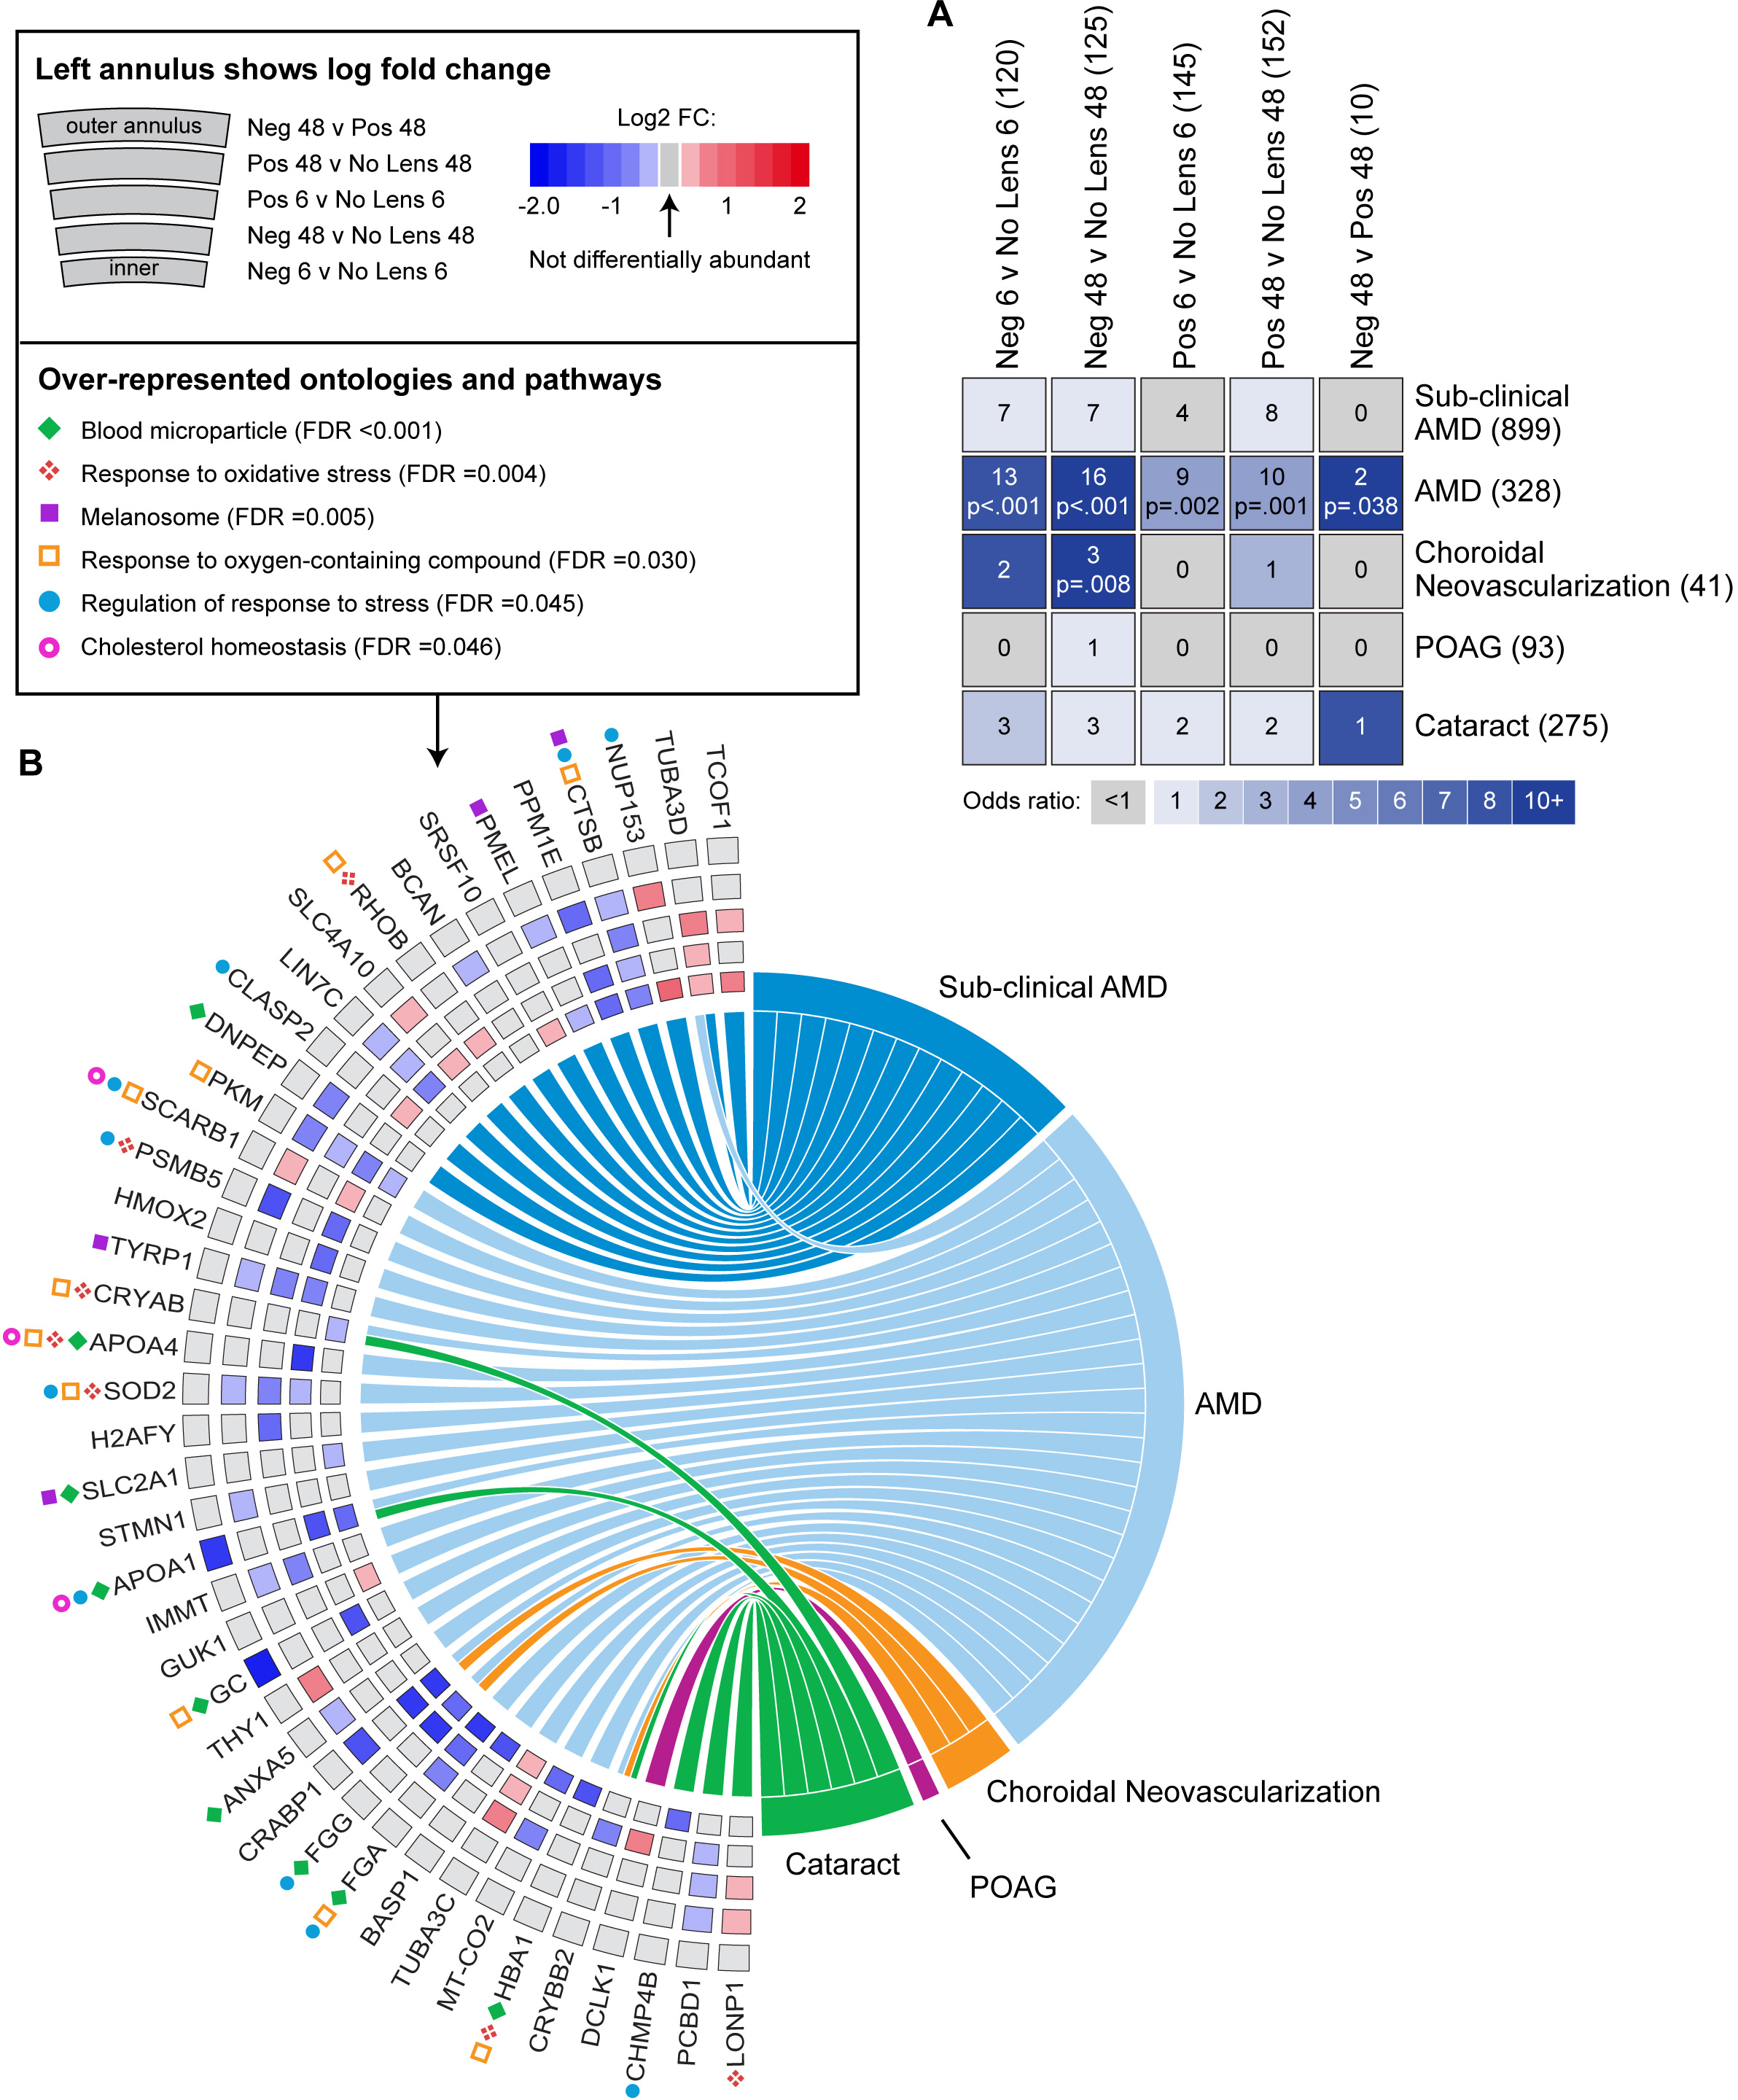
Figure 4. Comparison of single protein findings with the genes and proteins linked to ocular pathologies in humans.
A: Table showing overlap between differentially abundant proteins in the present study and the genes and proteins previously
associated with sub-clinical AMD, AMD, choroidal neovascularization, POAG, and cataract in humans. The number of genes and
proteins in each list is shown in parentheses after the list name. List intersections (i.e., the number of overlapping findings)
and Benjamini-Hochberg adjusted p values are superimposed on the grid.
B: Chord diagram showing the individual genes and proteins that were differentially abundant in the present study and associated
with an ocular pathology (i.e., all intersecting genes and proteins from
Figure 4A). The fold change of individual proteins in the present study is shown on the left side of the chord diagram, with the position
in the annulus indicating the condition. Left-right connections indicate protein associations with ocular pathologies. Protein
contributions to a subset of significant ontology over-representations are indicated with symbols in panel
B. Neg = negative lens, Pos = positive lens, AMD = age-related macular degeneration, POAG = primary open angle glaucoma.
 Figure 4 of
Riddell, Mol Vis 2017; 23:872-888.
Figure 4 of
Riddell, Mol Vis 2017; 23:872-888.