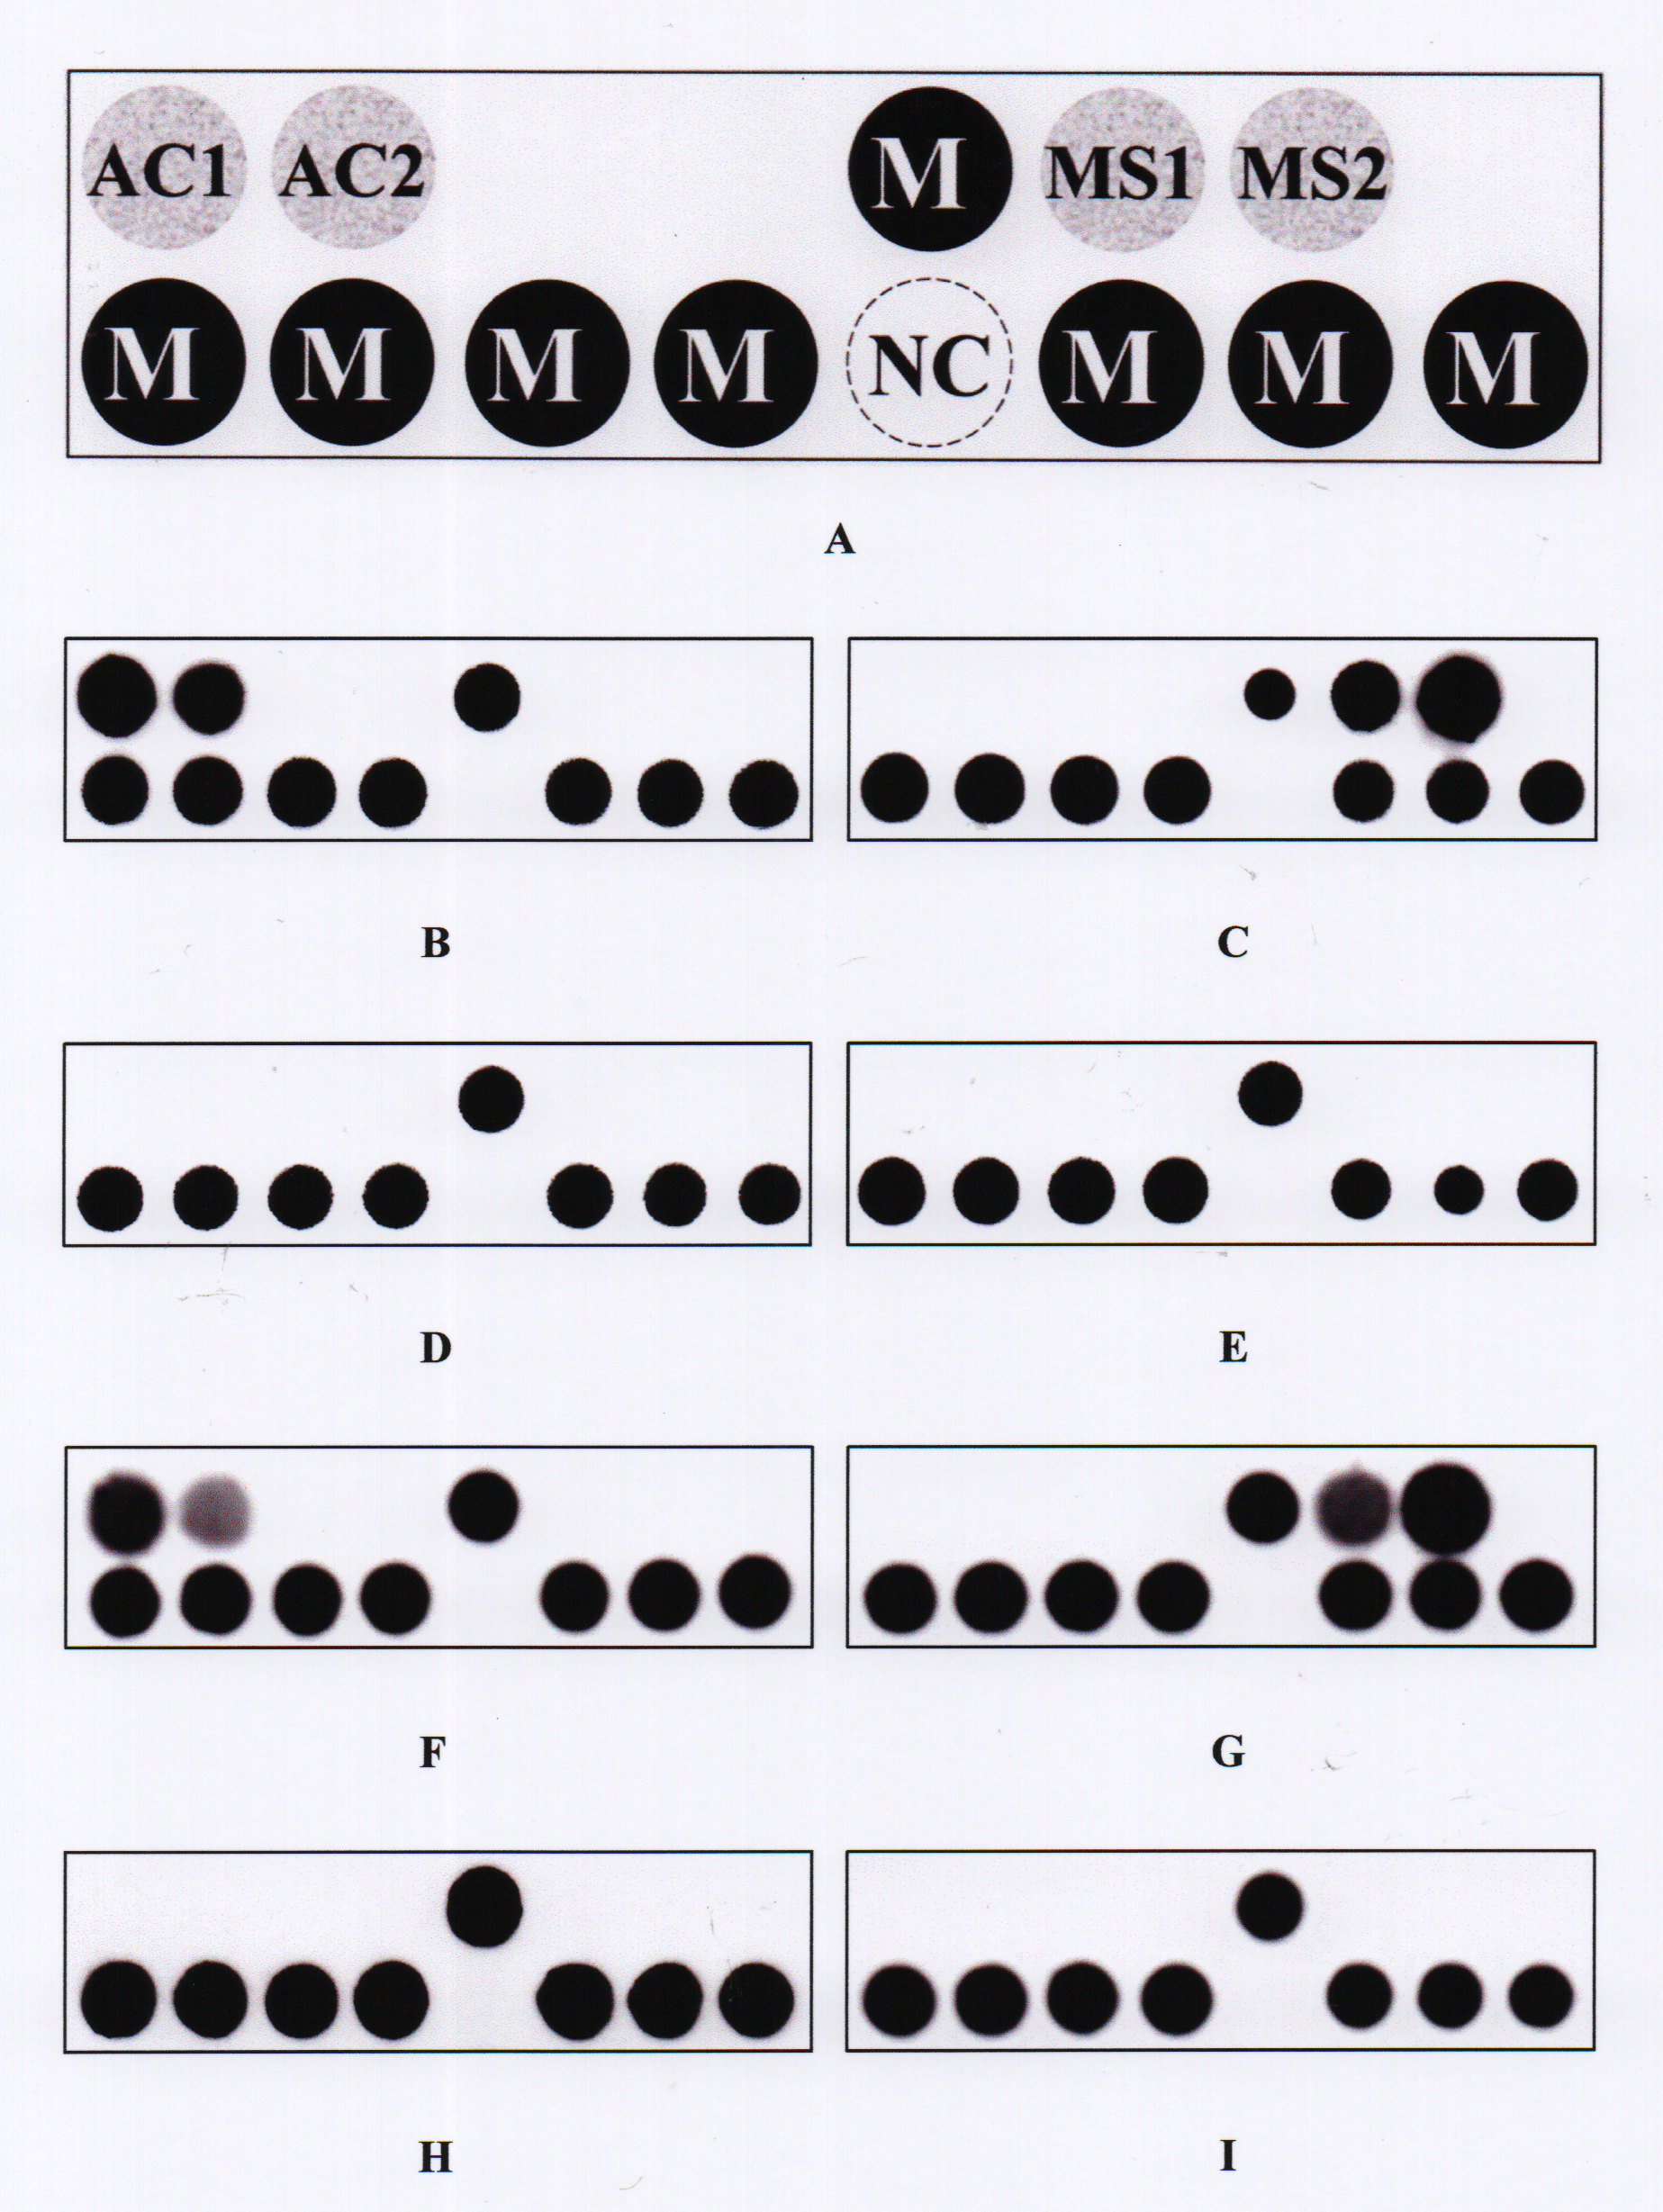
Figure 1. The PDH model.
A: Layout of oligonucleotide probes on the model (0.8 × 0.2 cm). The probes “AC1” and “AC2” were used to identify
Acanthamoeba spp. The probes “MS1” and “MS2” were used to identify microsporidia. The dot “NC” is a negative control (tracing dye only).
The probe “M” is a position marker probe, i.e., an irrelevant digoxigenin-labeled oligonucleotide probe (5ʹ-digoxigenin-GCA
TAT CAA TAA GCG GAG GA-3ʹ). All probe sequences are listed in
Table 2.
B−
E: Representative hybridization patterns for
Acanthamoeba castellanii ATCC 30,010,
Encephalitozoon cuniculi ATCC 50,789,
Pseudomonas aeruginosa BCRC 10,944, and
Fusarium solani BCRC 32,446, respectively.
F−
I: Hybridization patterns for the represented clinical samples that were positive for
Acanthamoeba (sample no. 1e), positive for microsporidia (sample no. 1a), false negative for
Acanthamoeba (sample no. 1f), and true negative (sample no. 1g).
 Figure 1 of
Huang, Mol Vis 2017; 23:614-623.
Figure 1 of
Huang, Mol Vis 2017; 23:614-623.