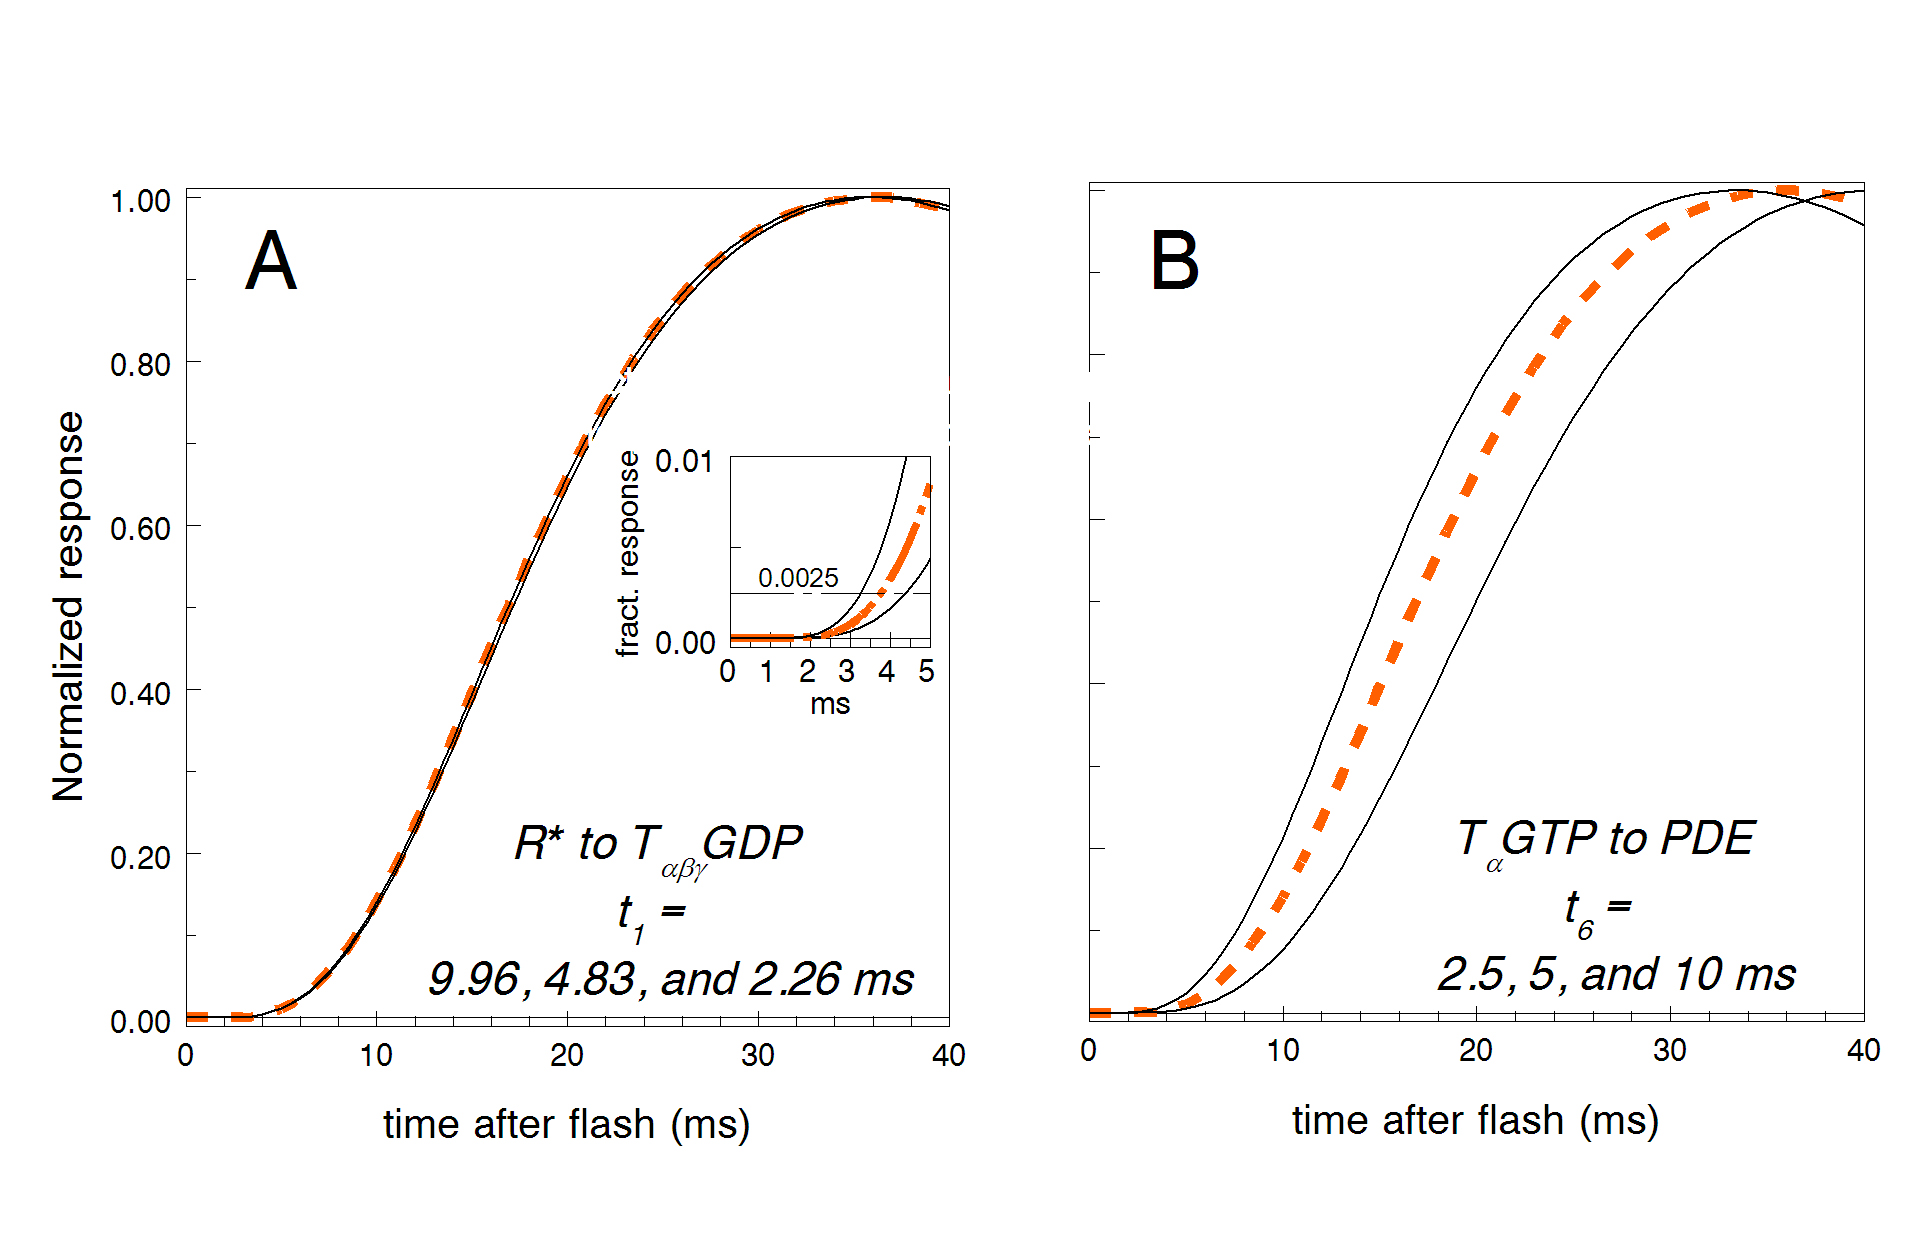
Figure 9. Effect of various activation steps on the photocurrent response delay. In all panels, the red dashed line is the best fit
taken from the model of
Figure 7B. In the main panels
A and
B, each response is normalized to unit at its peak.
A: The duration of the R*–T activation cycle was changed twofold either way from the optimum value by changing the time-limiting
step
t1 while keeping
t2,
t3, and
t4 constant at 0.1 ms. In the insert, the initial phase of the responses is shown on an expanded scale, and the responses are
presented as fractional, that is, normalized to the saturated response. It is seen that the formally defined delay (time of
crossing the criterion level) changes by about 1 ms when the duration of the activation cycle varies between 2.5 and 10 ms.
If the responses are scaled to unit at their peaks (main panel
A), the resulting curves are virtually congruent. They do not exhibit any noticeable shift along the time axis.
B: The twofold variation in the time of
TαGTP and phosphodiesterase (PDE) interaction (
t6) greatly changed the delay. Only the time of less than or equal to 5 ms was consistent with the observed cone response. The
non-normalized amplitude of the response in
B does not perceptibly change when
t6 is varied.
 Figure 9 of
Rotov, Mol Vis 2017; 23:416-430.
Figure 9 of
Rotov, Mol Vis 2017; 23:416-430.