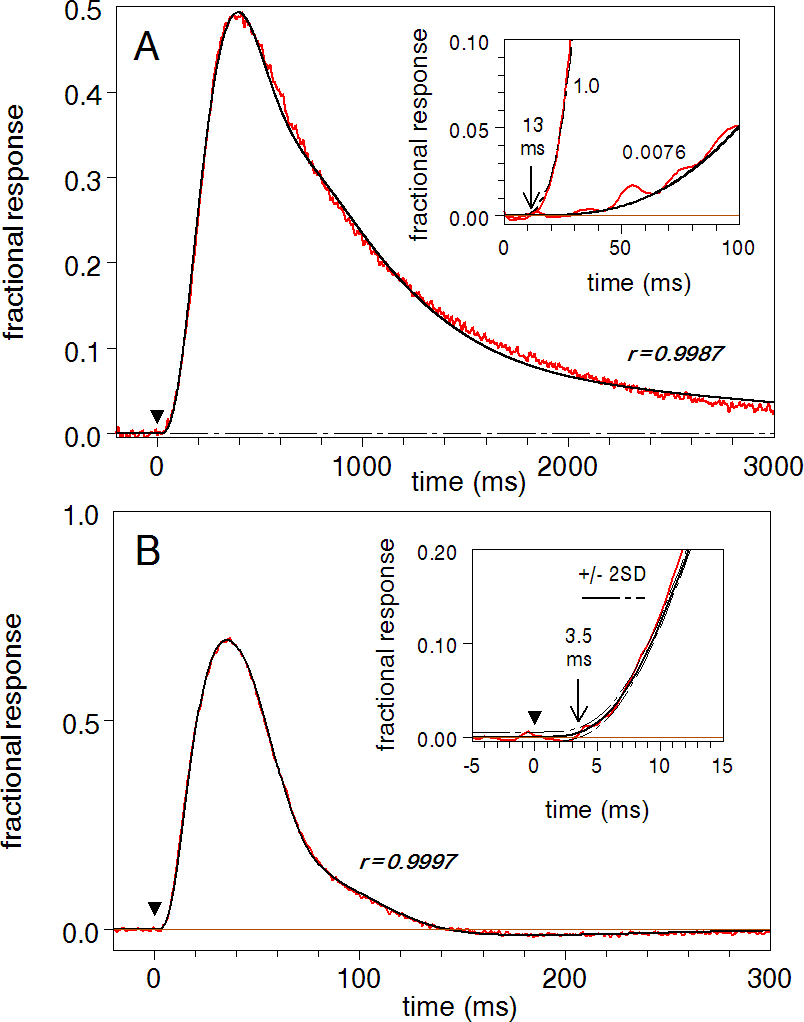
Figure 7. Modeling flash responses of frog rods and red-sensitive cones. The red lines are the experimental recordings; the black lines
are the model responses. Black downward triangles show the beginning of a 1-ms stimulating flash.
A: Suction pipette recording from a frog rod. The insert shows the initial part of the response on an expanded scale. The numbers
at the curves indicate the relative intensities of 525-nm flashes. Intensity 1.0 corresponds to the fractional bleach of 1.6
× 10
−5 per flash; average of 30 responses.
B: Transretinal recording of the aspartate-isolated cone receptor potential; rod activity is suppressed by the 525-nm steady
background. The stimulus is a 1-ms orange (longer than 600 nm) flash; fractional bleach 6.8 × 10
−5 per flash; average of 100 responses.
r is the coefficient of correlation between the experimental and model curves. Parameters of the fits are given in
Table 2.
 Figure 7 of
Rotov, Mol Vis 2017; 23:416-430.
Figure 7 of
Rotov, Mol Vis 2017; 23:416-430.