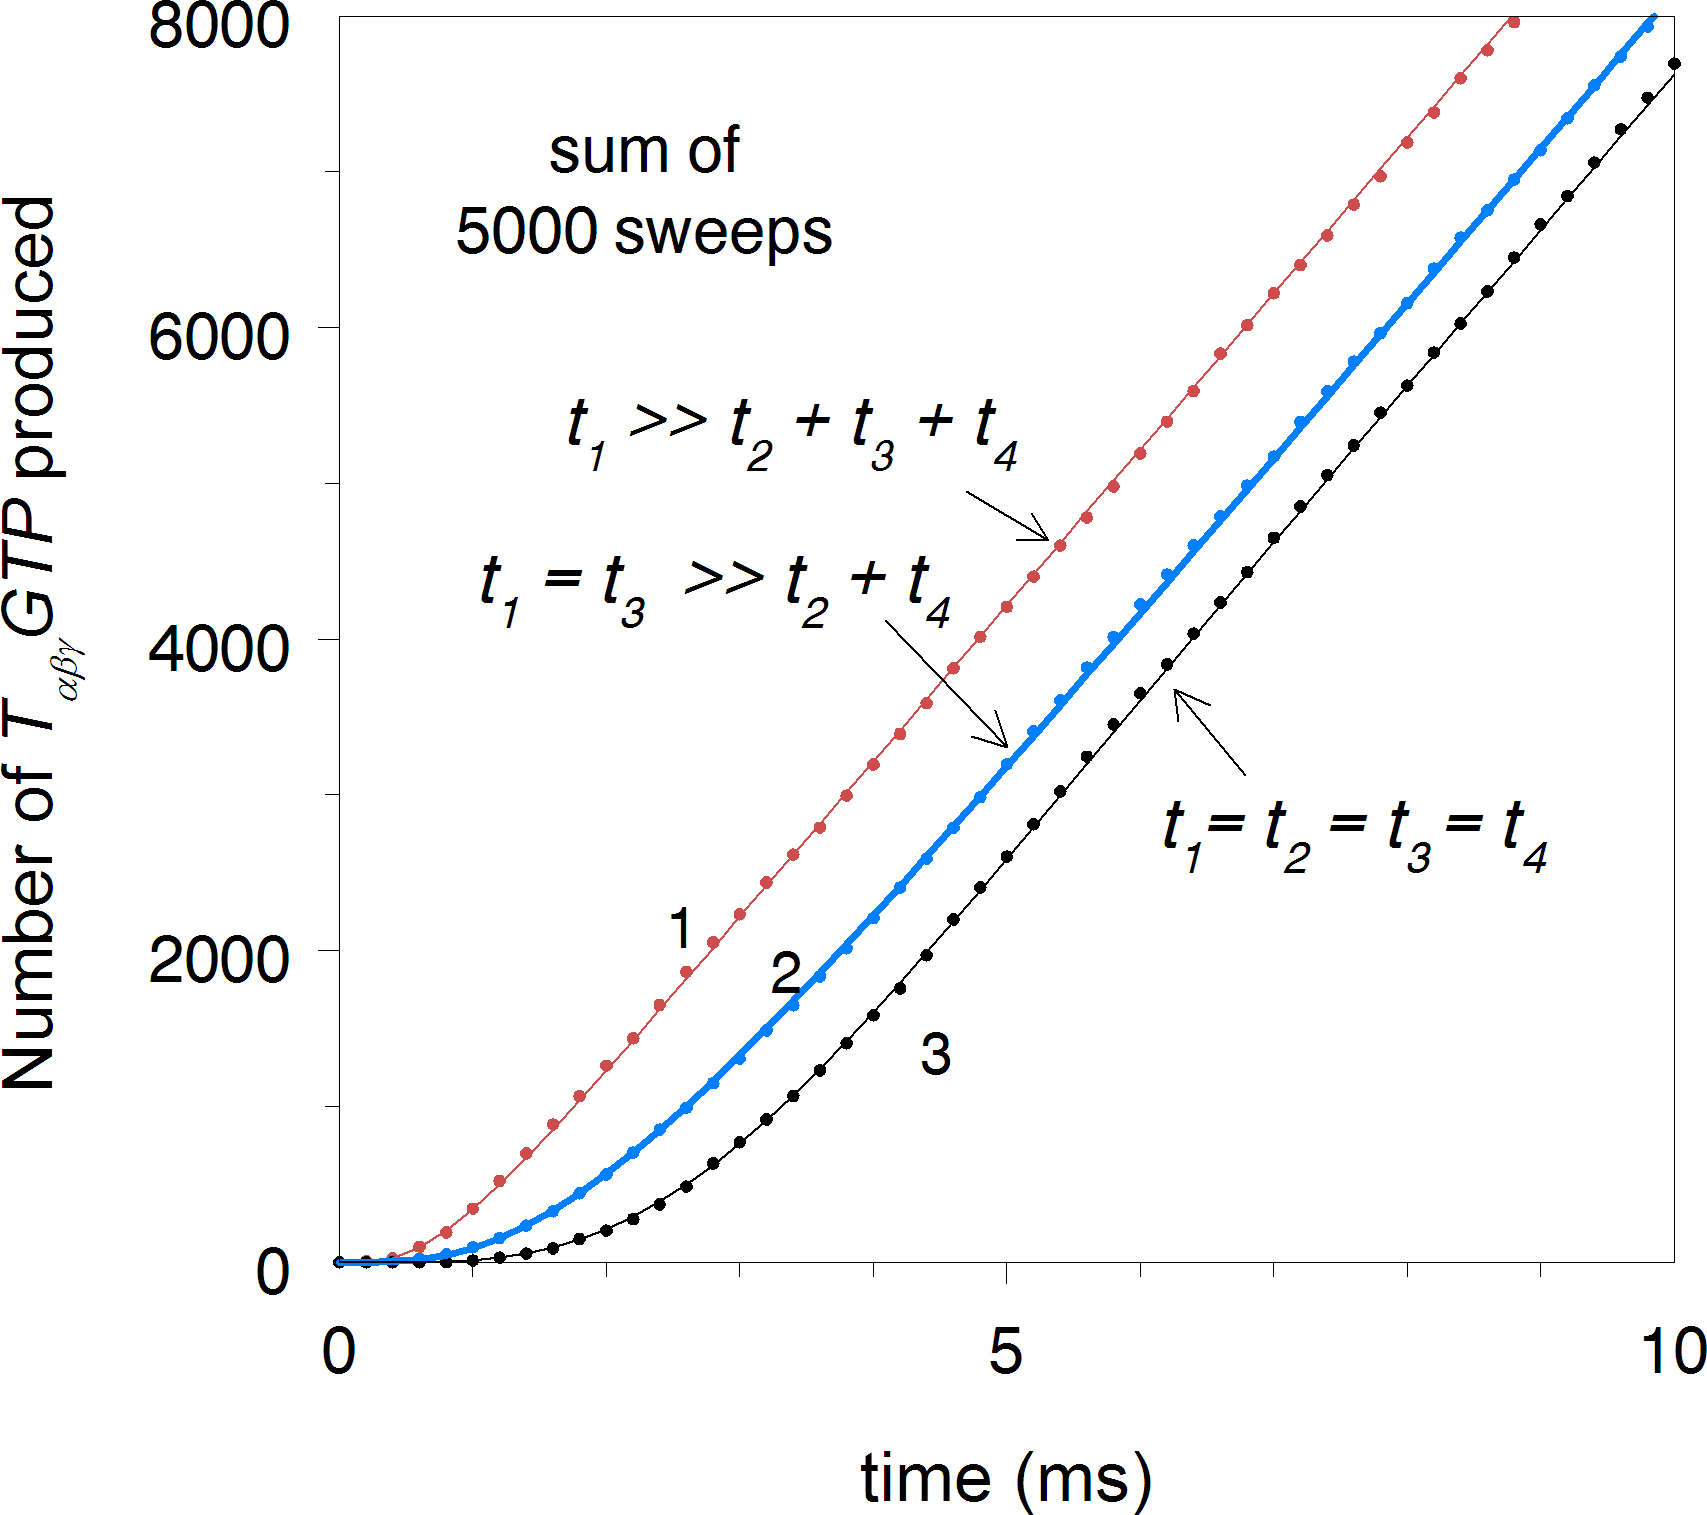
Figure 5. Effect of the number of rate-limiting steps within the activation cycle on the
TαβγGTP production delay. A stochastic simulation of the activation cycle was performed fixing the total duration of the cycle (
t1 + t2 + t3 + t4 = 1/vRE = 5 ms,
Figure 1 and
Figure 2) but varying the contributions of individual steps to it. Curve 1,
t1 = 4.7 ms,
k2 = k3 = k4 = 0.1 ms. Curve 2,
k1 = k2 = 2.4 ms,
k3 = k4 = 0.1 ms. Curve 3,
k1 = k2 =
k3 = k4 = 1.25 ms. Smooth lines through the dots show the results of continuous deterministic computations using the same parameters.
 Figure 5 of
Rotov, Mol Vis 2017; 23:416-430.
Figure 5 of
Rotov, Mol Vis 2017; 23:416-430.