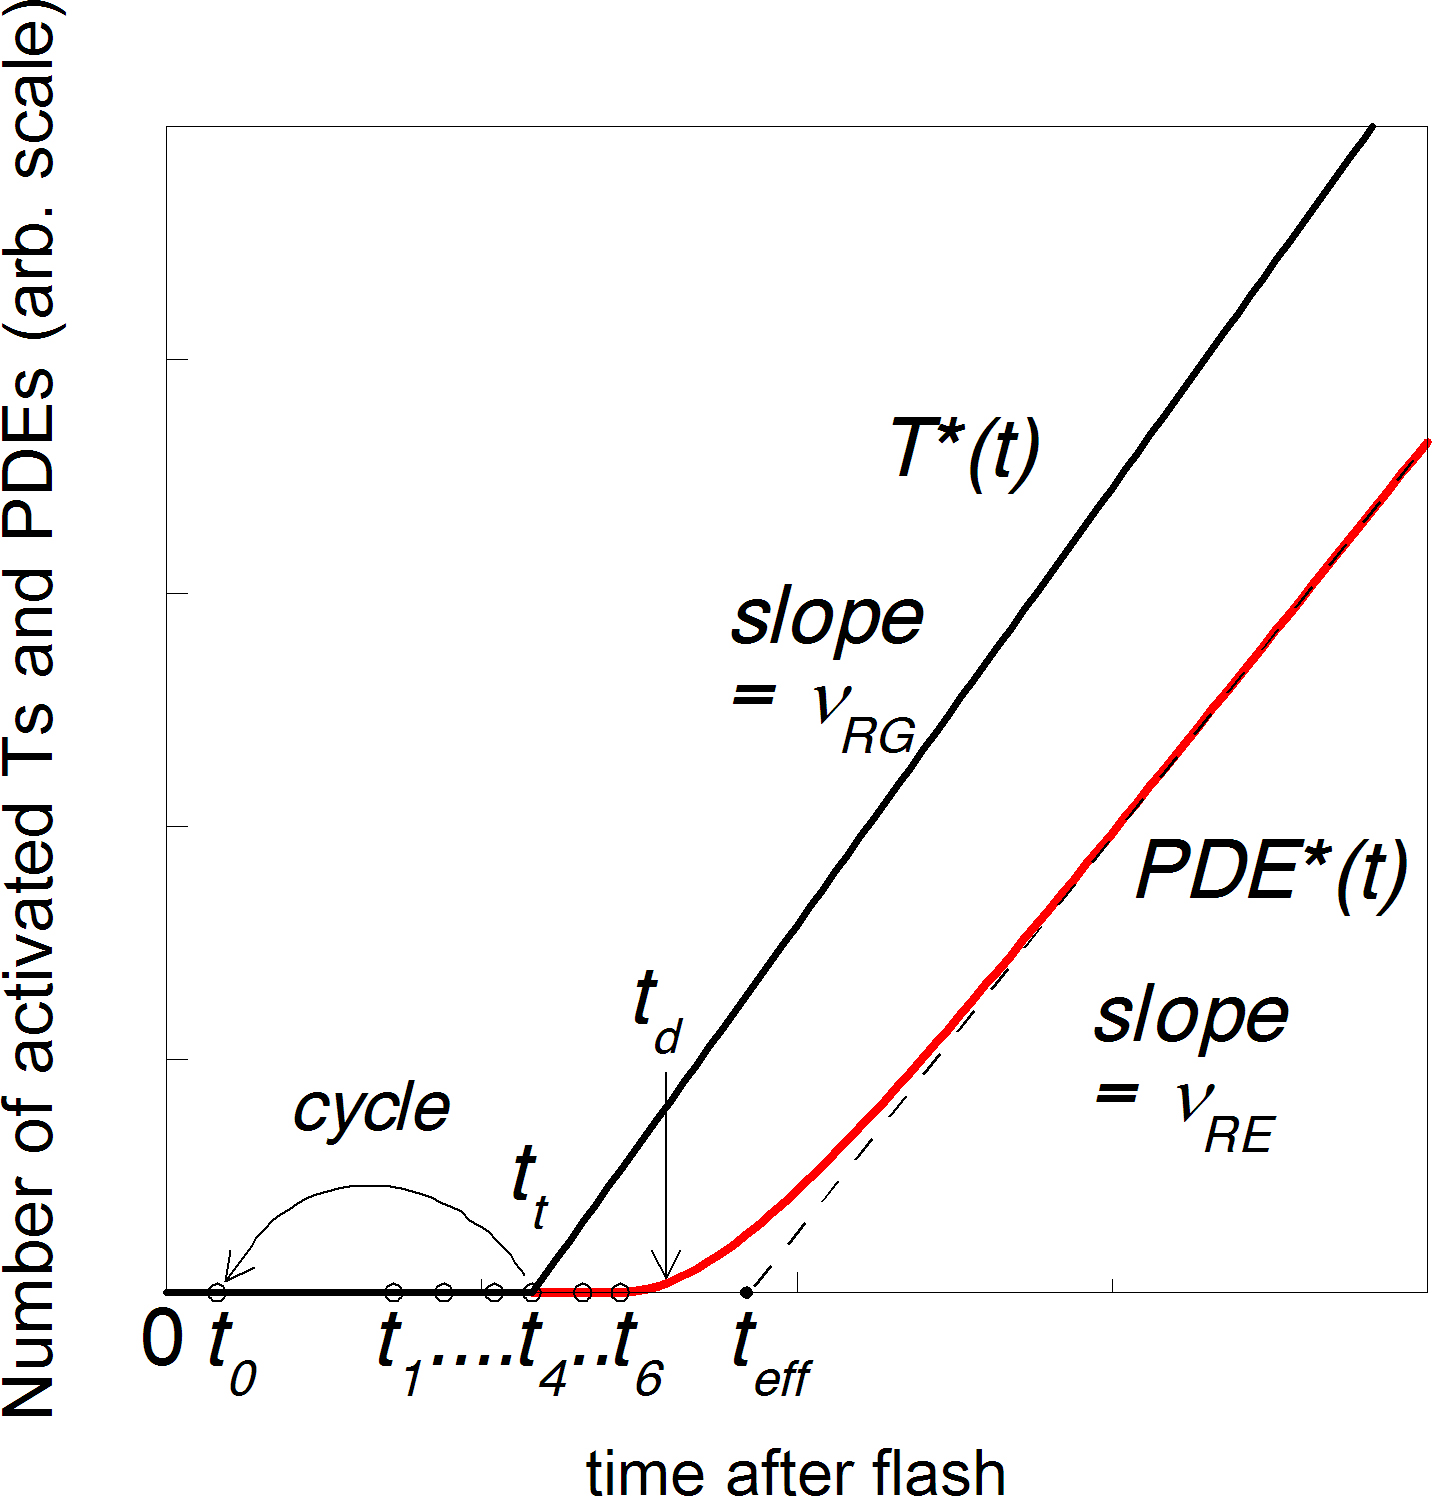
Figure 2. Time course of the production of active transducin (T*) and phosphodiesterase (PDE*) (modified from [
1-
3]). Times from
t0 to
t6 represent the durations of corresponding transitions in
Figure 1 (state 0 to state 1, state 1 to state 2, etc.). The straight line initiating from
t4 shows the time course of T* production, at the rate of
νRG. The first PDE* would ideally appear at
t6. The bent red line shows a more realistic approximation that may result from the extra delay between T*–PDE binding and activation
of PDE.
νRE is the steady rate of PDE* production achieved after an effective delay
teff. In accordance with [
3], we further assume
νRE =
νRG.
td >
t6 is placed, rather arbitrarily, as the delay time when the minimum deviation of PDE* from its dark level can be detected.
 Figure 2 of
Rotov, Mol Vis 2017; 23:416-430.
Figure 2 of
Rotov, Mol Vis 2017; 23:416-430.