Figure 2. JQ1 ameliorates NMDA-induced RGC loss counted on retinal whole mounts. Intravitreal injections were performed as described
in
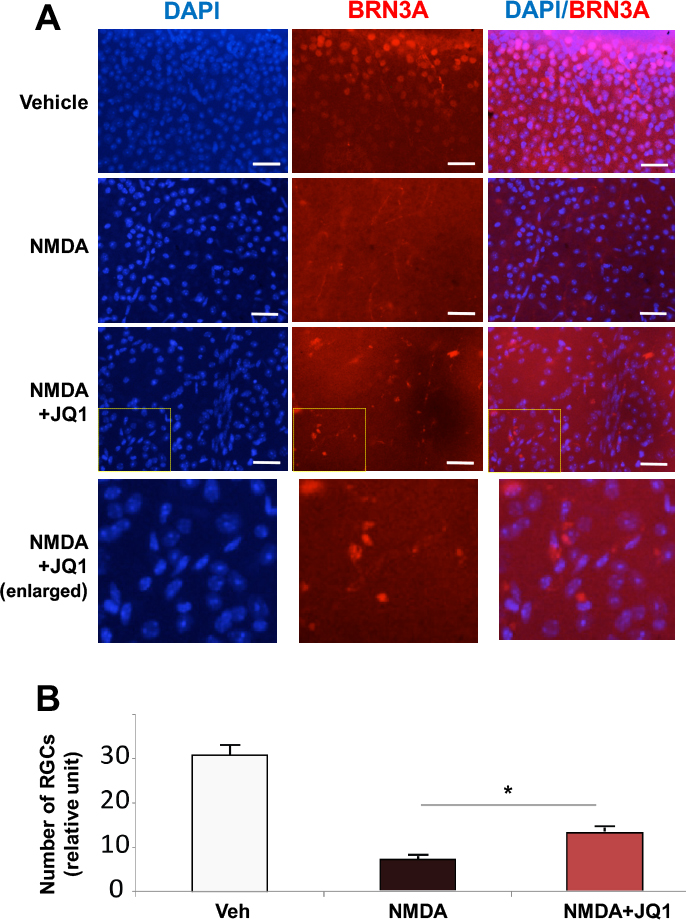
Figure 1. Mice were euthanized at day 7 post injection, and retinal whole mounts were prepared for fluorescence microscopy.
A: Representative images of BRN3A immunostaining. Scale bar: 50 μm. To highlight BRN3A-positive cells, boxed areas within the
dashed line are enlarged below.
B: Quantification of BRN3A-positive cells: mean ± SEM; n=6–9 animals. *p<0.05, compared to NMDA alone.
 Figure 2 of
Li, Mol Vis 2017; 23:149-159.
Figure 2 of
Li, Mol Vis 2017; 23:149-159.