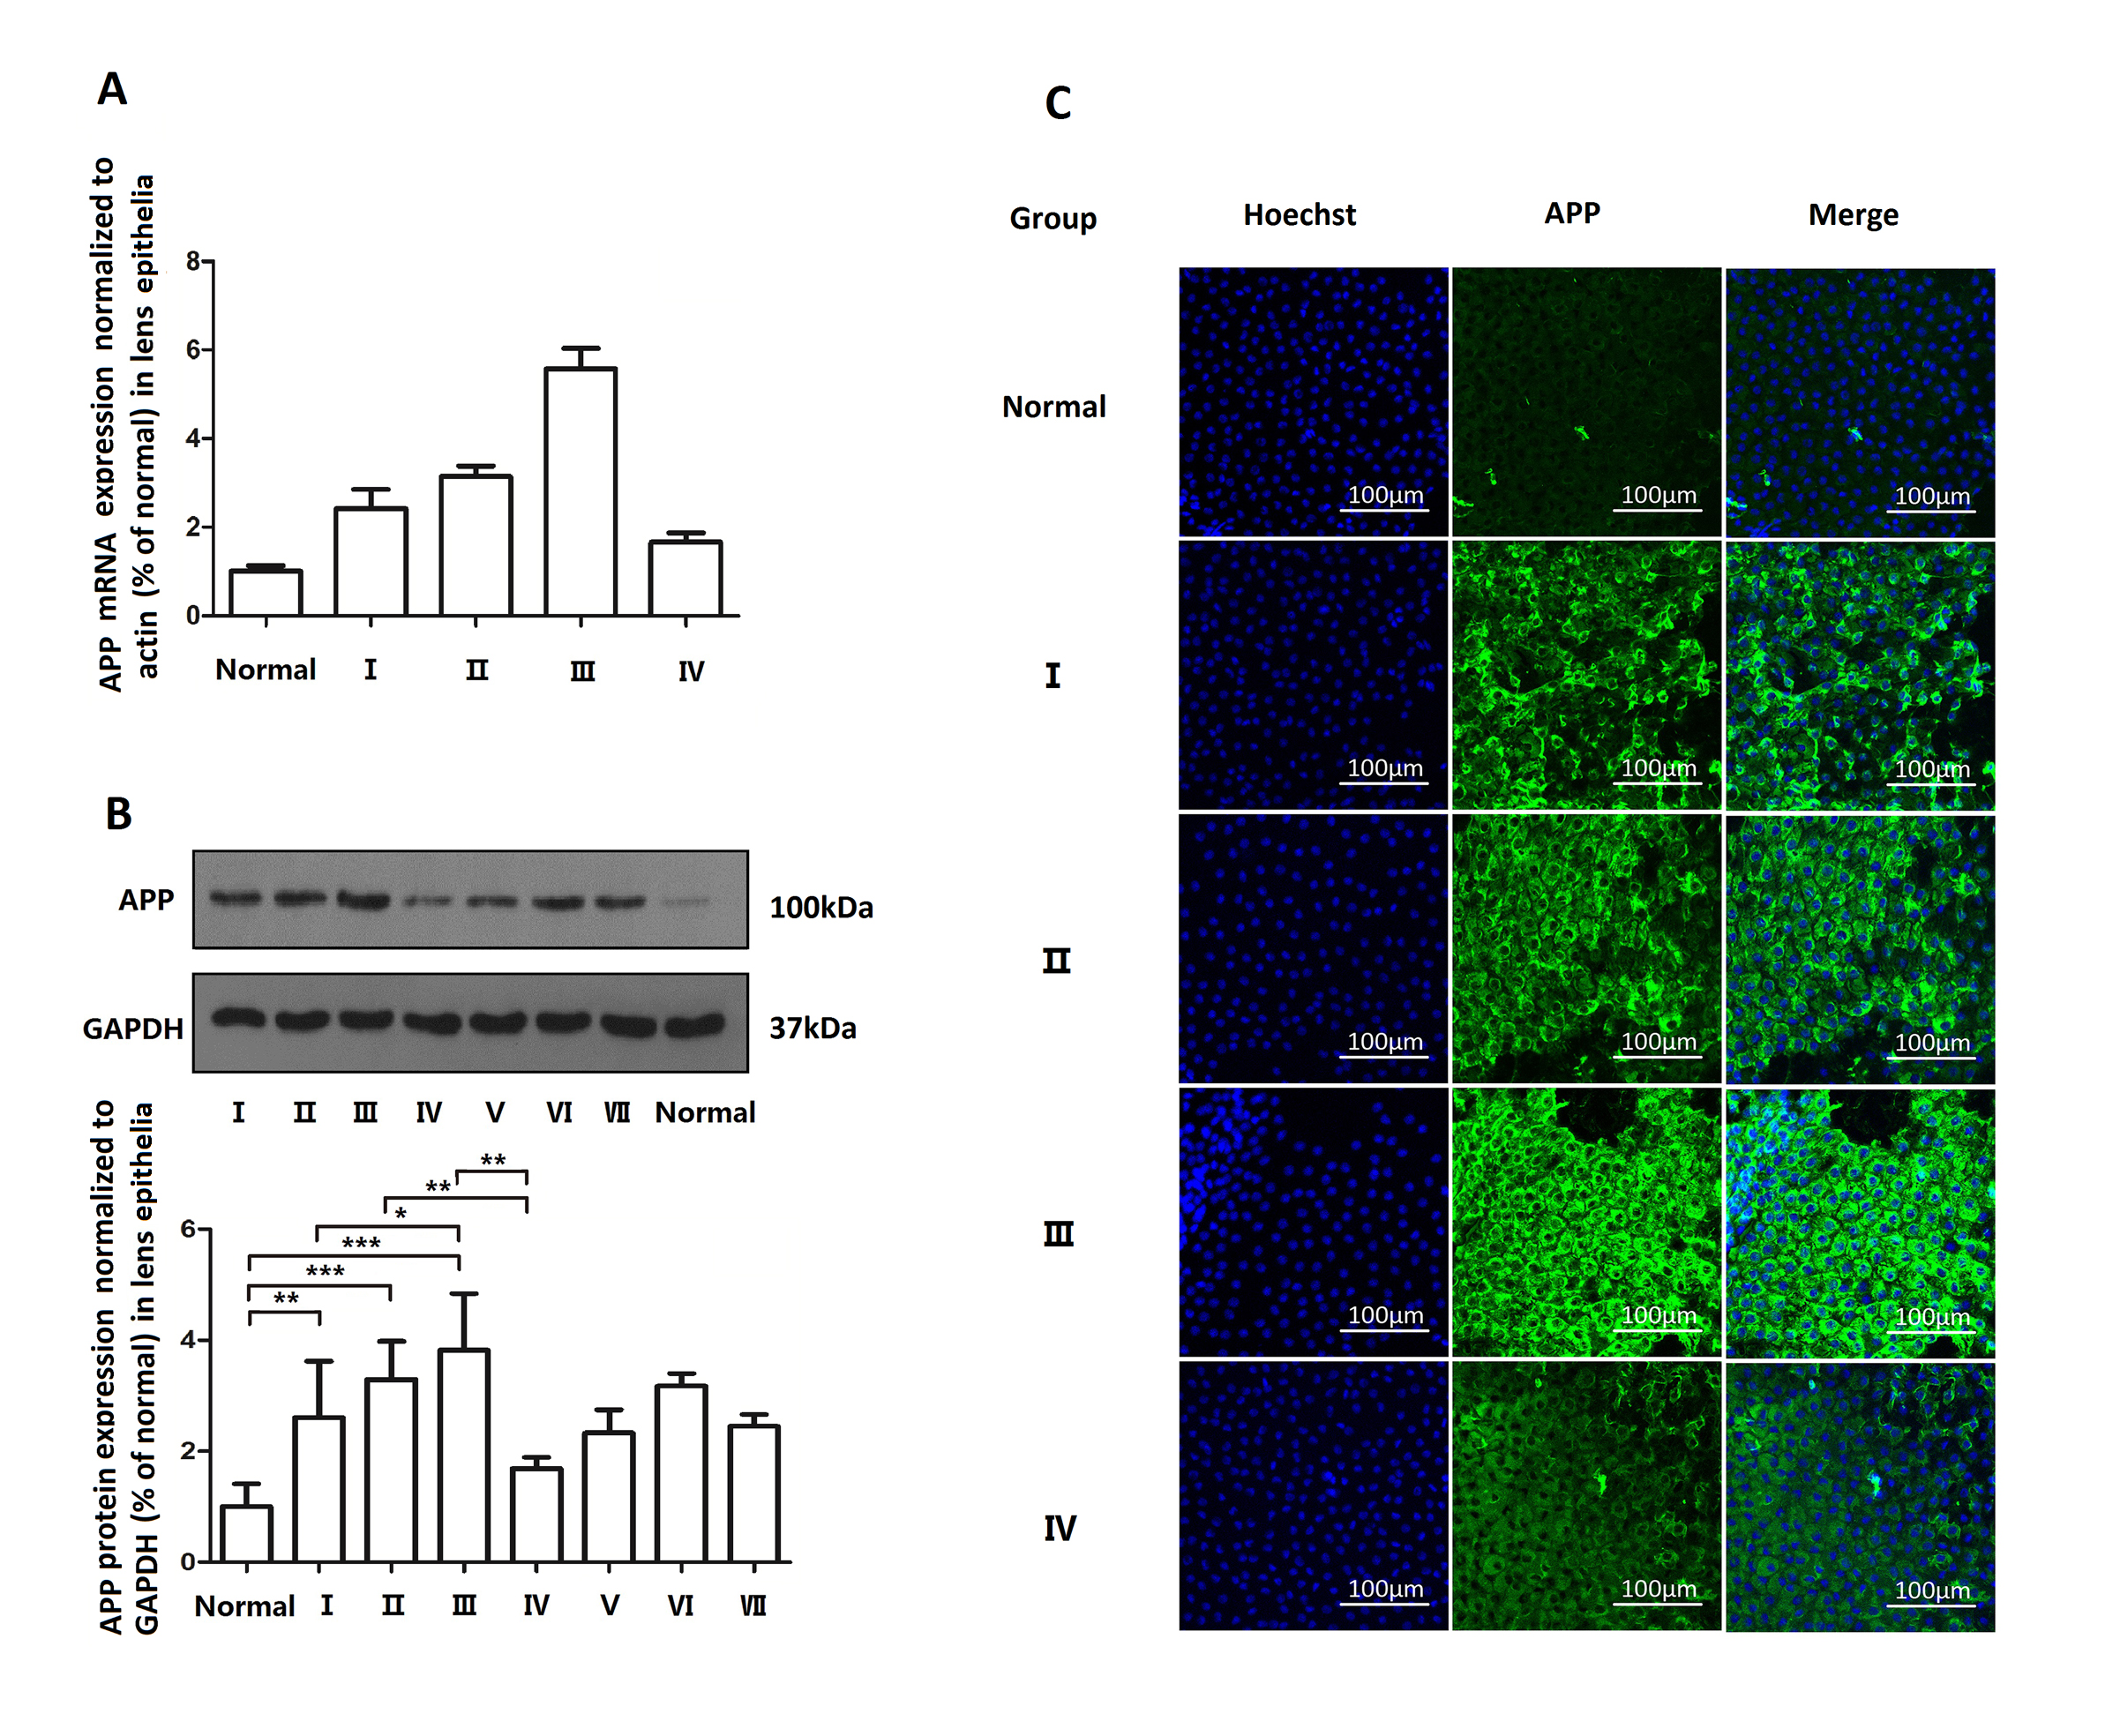
Figure 2. APP expression levels in lens epithelia of healthy and cataract eyes.
A: Real-time PCR analysis of amyloid-β precursor protein (APP) in lens epithelia.
B: Western blot analysis of APP in lens epithelia.
C: Immunofluorescence of APP and Hoechst nuclear staining in lens epithelia. The cortical (C), nuclear (N), or posterior subcapsular
(P) opacity of the cataract was classified with the Lens Opacities Classification System III (LOCS III), with increasing cataract
severity from Group I to IV. Group I: C2–3N1–2; Group II, C3–4N2–3; Group III, C4–5N3–4; Group IV, C4–5N4–5; Group V, posterior
subcapsular senile cataract (P2-P4, with C<2 and n<2); Group VI, cataract with myopia; Group VII, cataract with diabetes;
and the healthy group, healthy tissue samples. In each group, three independent experiments were performed. The data are the
means ± standard deviation (SD). *p<0.05, **p<0.01, ***p<0.001, by one-way ANOVA and least significant difference (LSD) tests
among Groups I to IV and the healthy group. Significant differences between the ΔΔCt values of each group in
Figure 2A were found with one-way ANOVA (p<0.001) and LSD tests (p<0.05). Healthy samples were used as normal controls. The APP mRNA
and protein expression levels (% of healthy) were normalized to actin and GAPDH, respectively.
 Figure 2 of
Xu, Mol Vis 2017; 23:1015-1028.
Figure 2 of
Xu, Mol Vis 2017; 23:1015-1028.