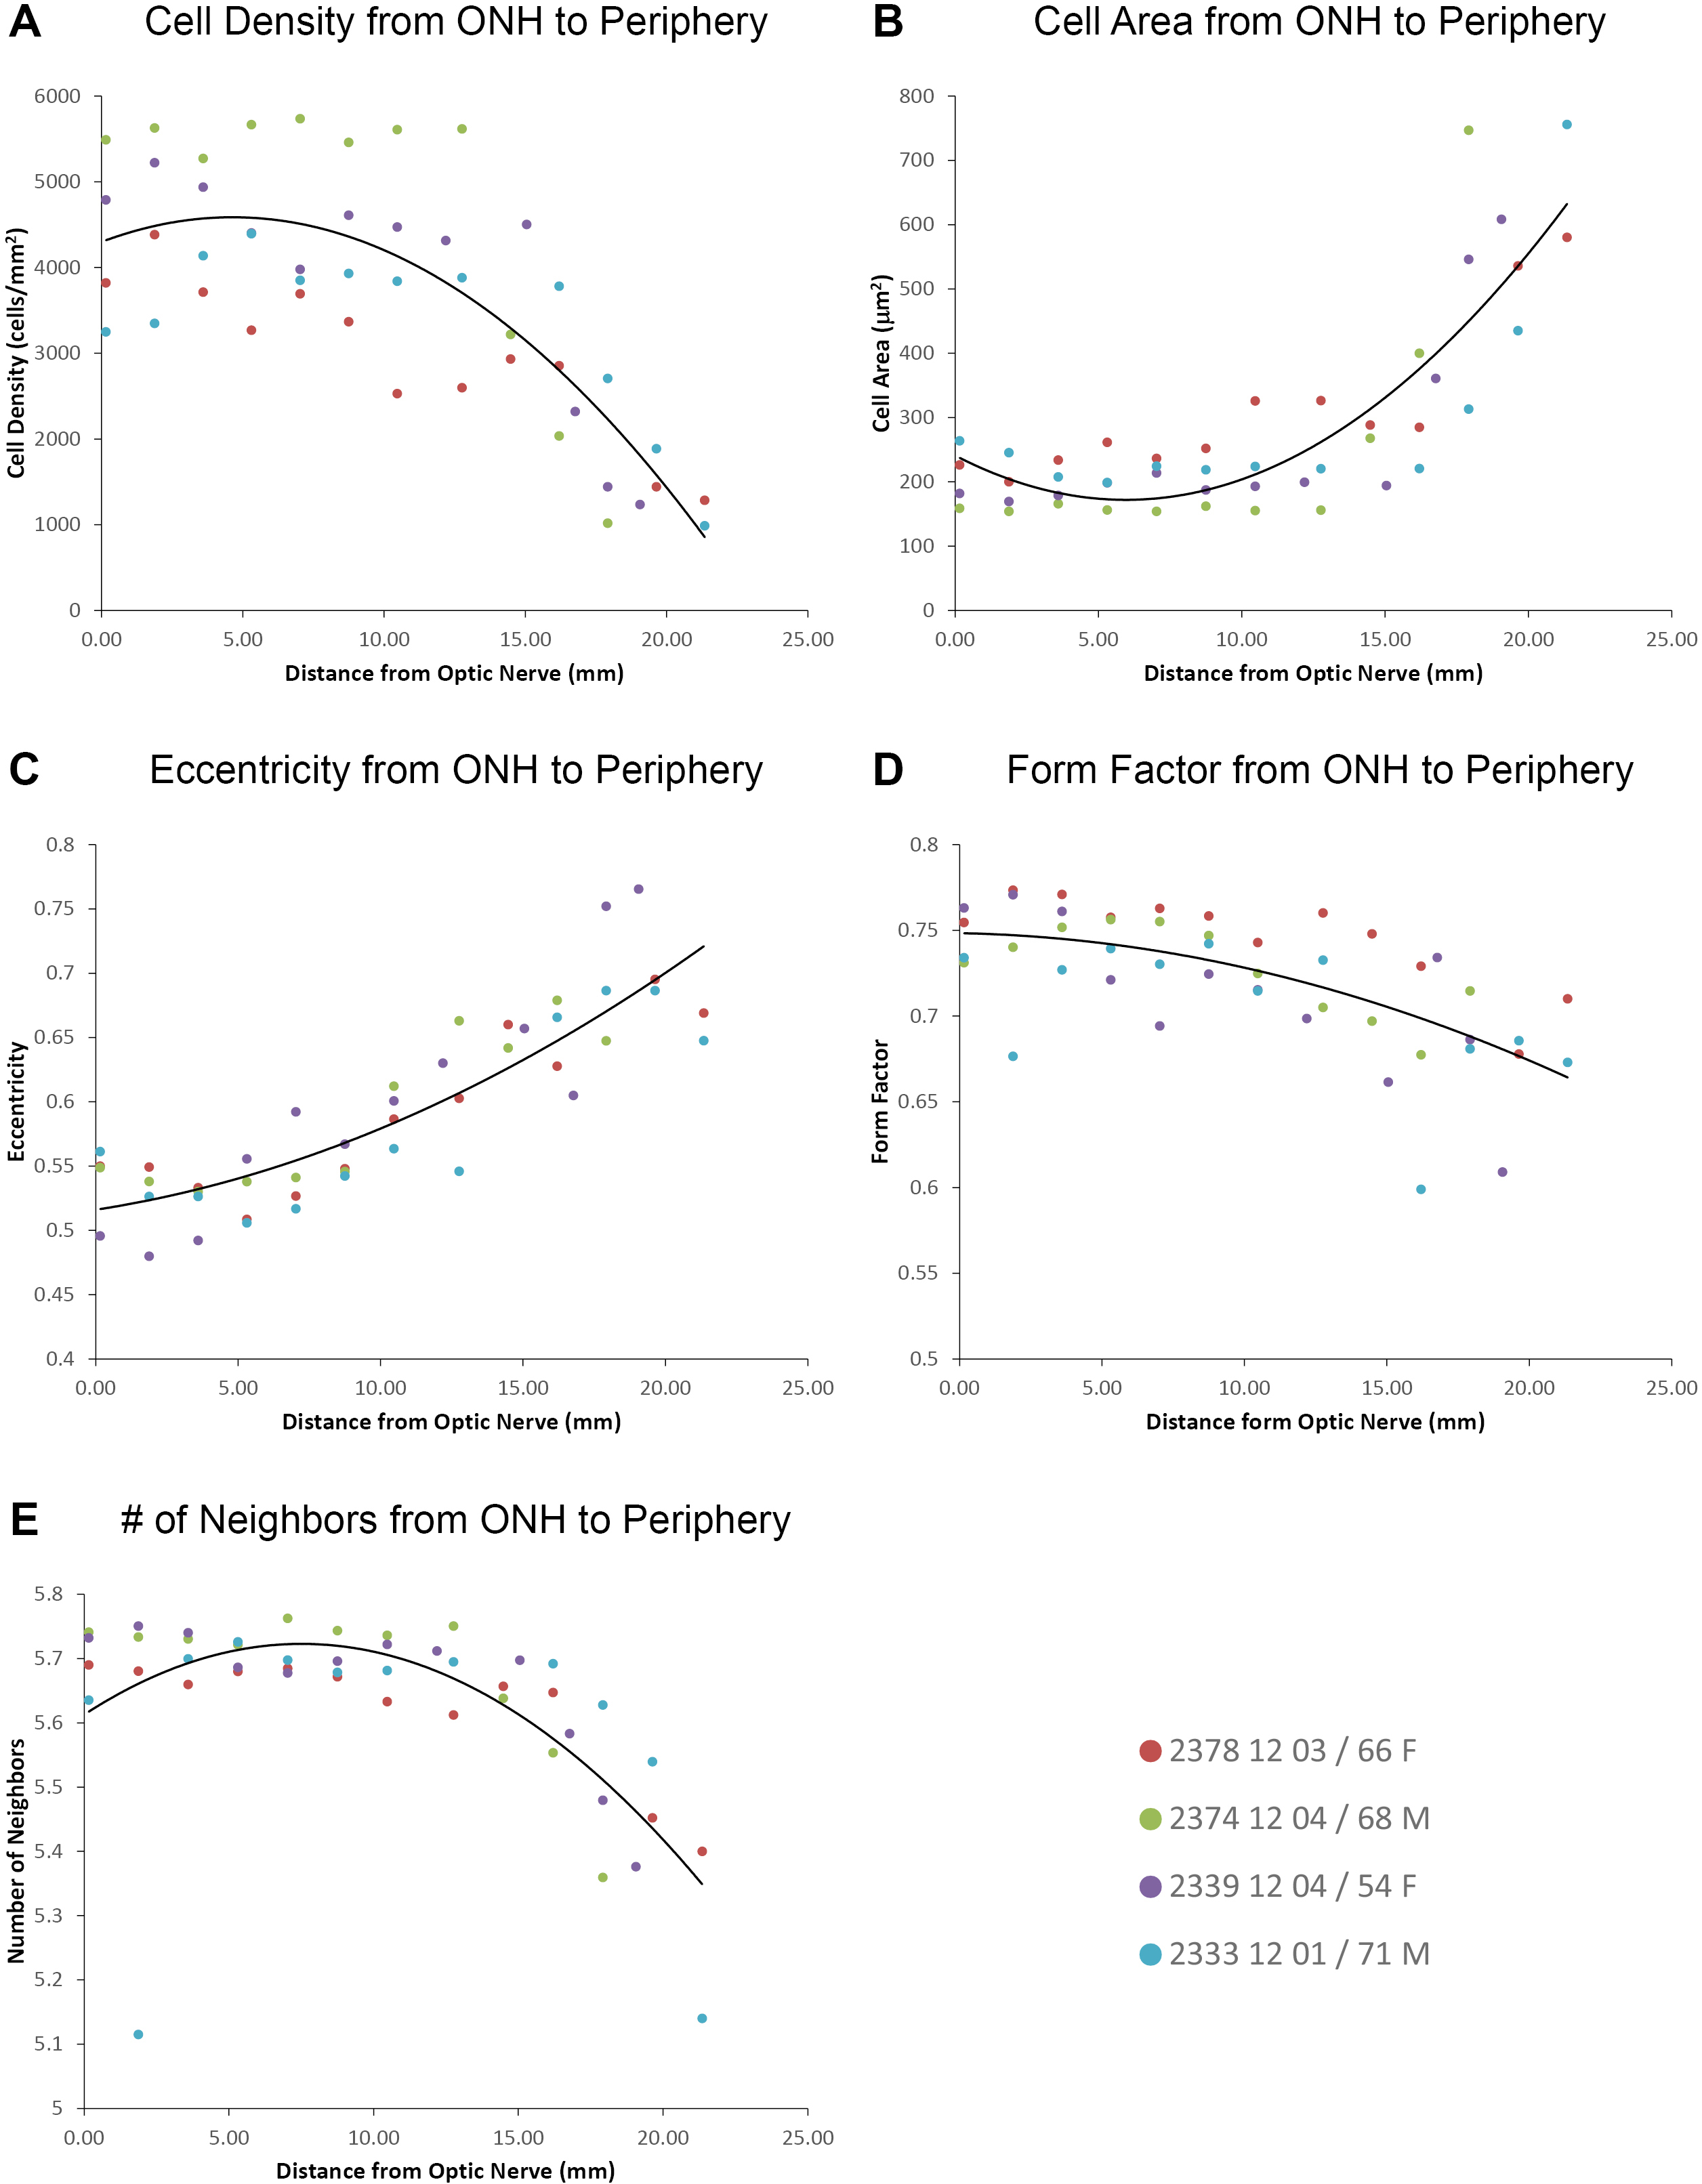
Figure 4. Location study.
A: Cell density from the optic nerve head (ONH) to the far periphery. Cell density appeared to remain consistent until approximately
13 mm from the optic nerve (i.e., the far periphery). Cell density at the posterior pole was more than four times greater
than at the far periphery.
B: Cell area according to distance from the ONH. The cell area appeared to remain consistent until approximately 15 mm from
the optic nerve (i.e., the far periphery). The mean cell areas at the far periphery were almost four times value at the macula/posterior
pole.
C: Eccentricity varies according to distance from the optic nerve head. There was a clear trend for increasing eccentricity
from the macula toward the far periphery. This was the only parameter where the comparison between the macula and the mid-periphery
was statistically significantly different.
D: Form factor variation from the optic nerve head to the far periphery. The highest form factor values were at the macular
region, correlating closely to a regular hexagon. Form factor values increased toward the far periphery, revealing the cells
became more elongated and asymmetric beyond the posterior pole.
E: Sidedness varies according to distance from the optic nerve head. The average number of neighboring cells is 5.7 in most
series (i.e., about three times as many hexagons as pentagons). We found a trend toward a decrease in sidedness, most pronounced
in the far periphery where there were about equal numbers of five- and six-sided RPE cells. The curves on each panel in
Figure 4 were created using the trendline tool in Excel and a second-order polynomial for regression. Each trendline was from all
four individuals.
 Figure 4 of
Bhatia, Mol Vis 2016; 22:898-916.
Figure 4 of
Bhatia, Mol Vis 2016; 22:898-916.