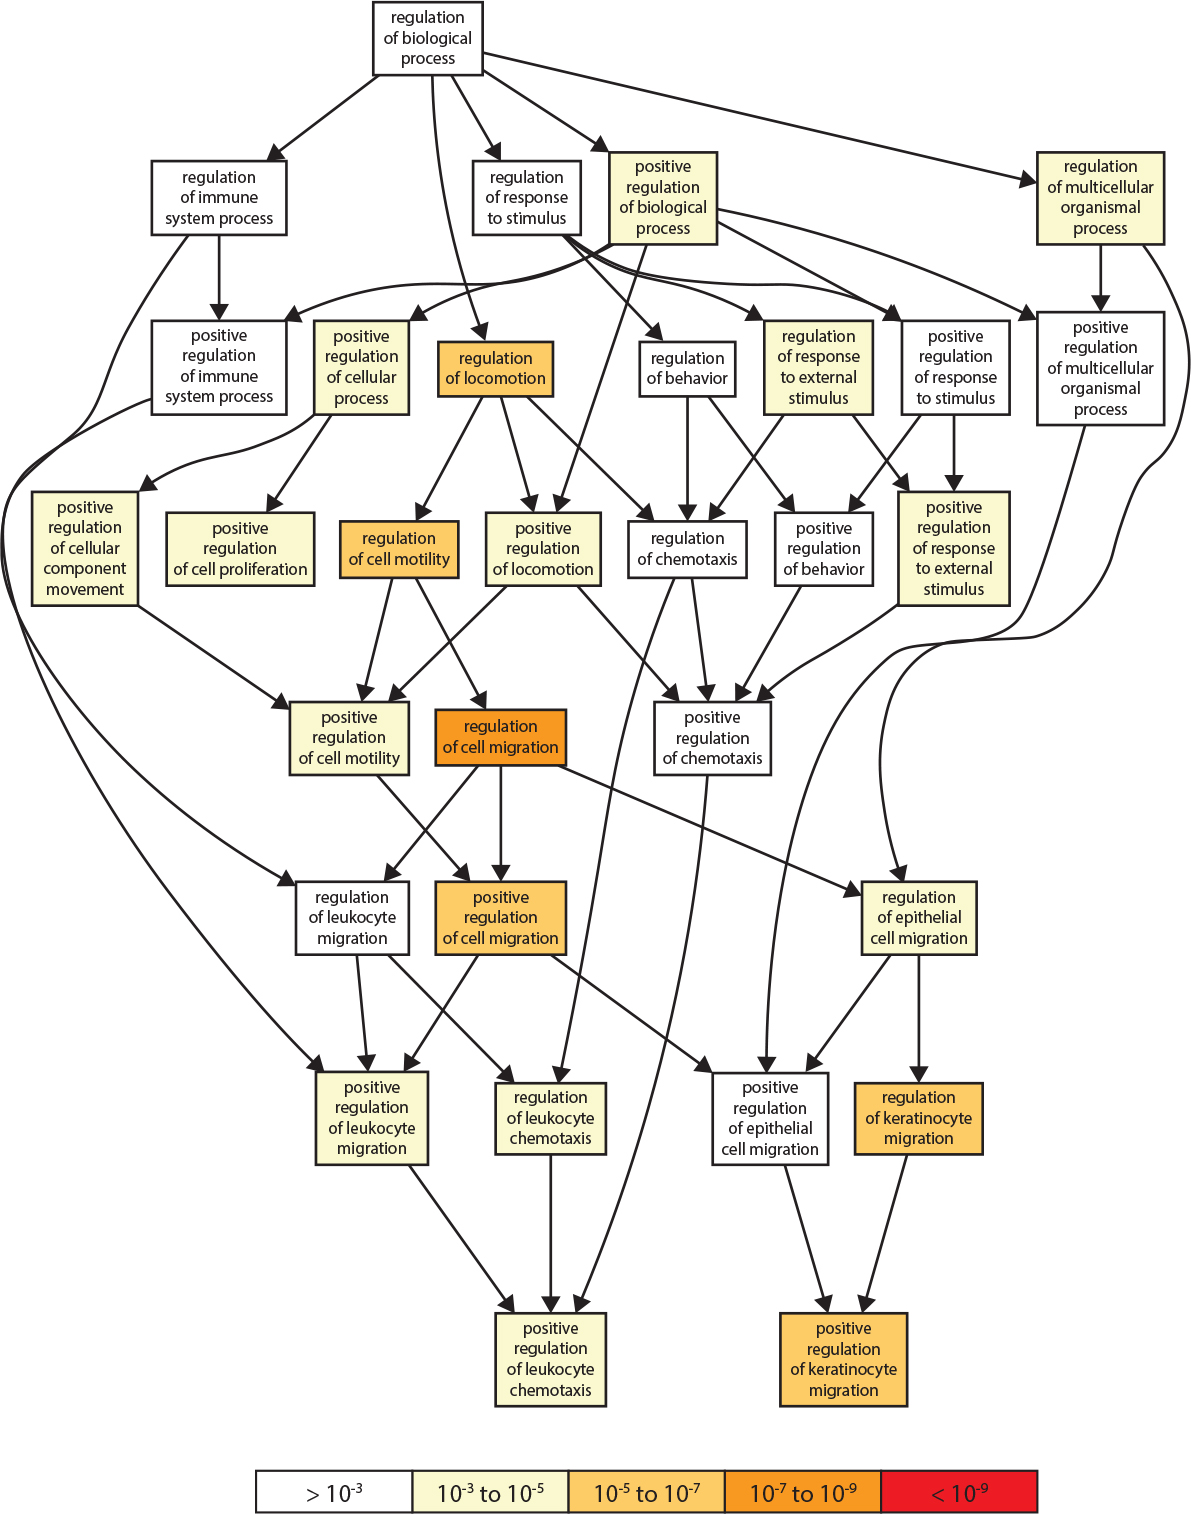
Figure 1. Gene Ontology of genes upregulated in response to PNN knockdown and graphical output of GOrilla for the ranked list of genes
upregulated after PNN knockdown. This Gene Ontology (GO) graph generated by GOrilla for identifying and visualizing enriched
GO terms in ranked lists of upregulated GOrilla searches for enriched GO terms that appear densely at the top of a ranked
list of genes. The system used 13,033 genes that are associated with a GO term
GO database and other sources. This figure represents a small portion of the output depicting the pathways associated with enhanced cell
migration. The genes identified in this cell behavior are presented in
Table 3.
 Figure 1 of
Akin, Mol Vis 2016; 22:40-60.
Figure 1 of
Akin, Mol Vis 2016; 22:40-60.