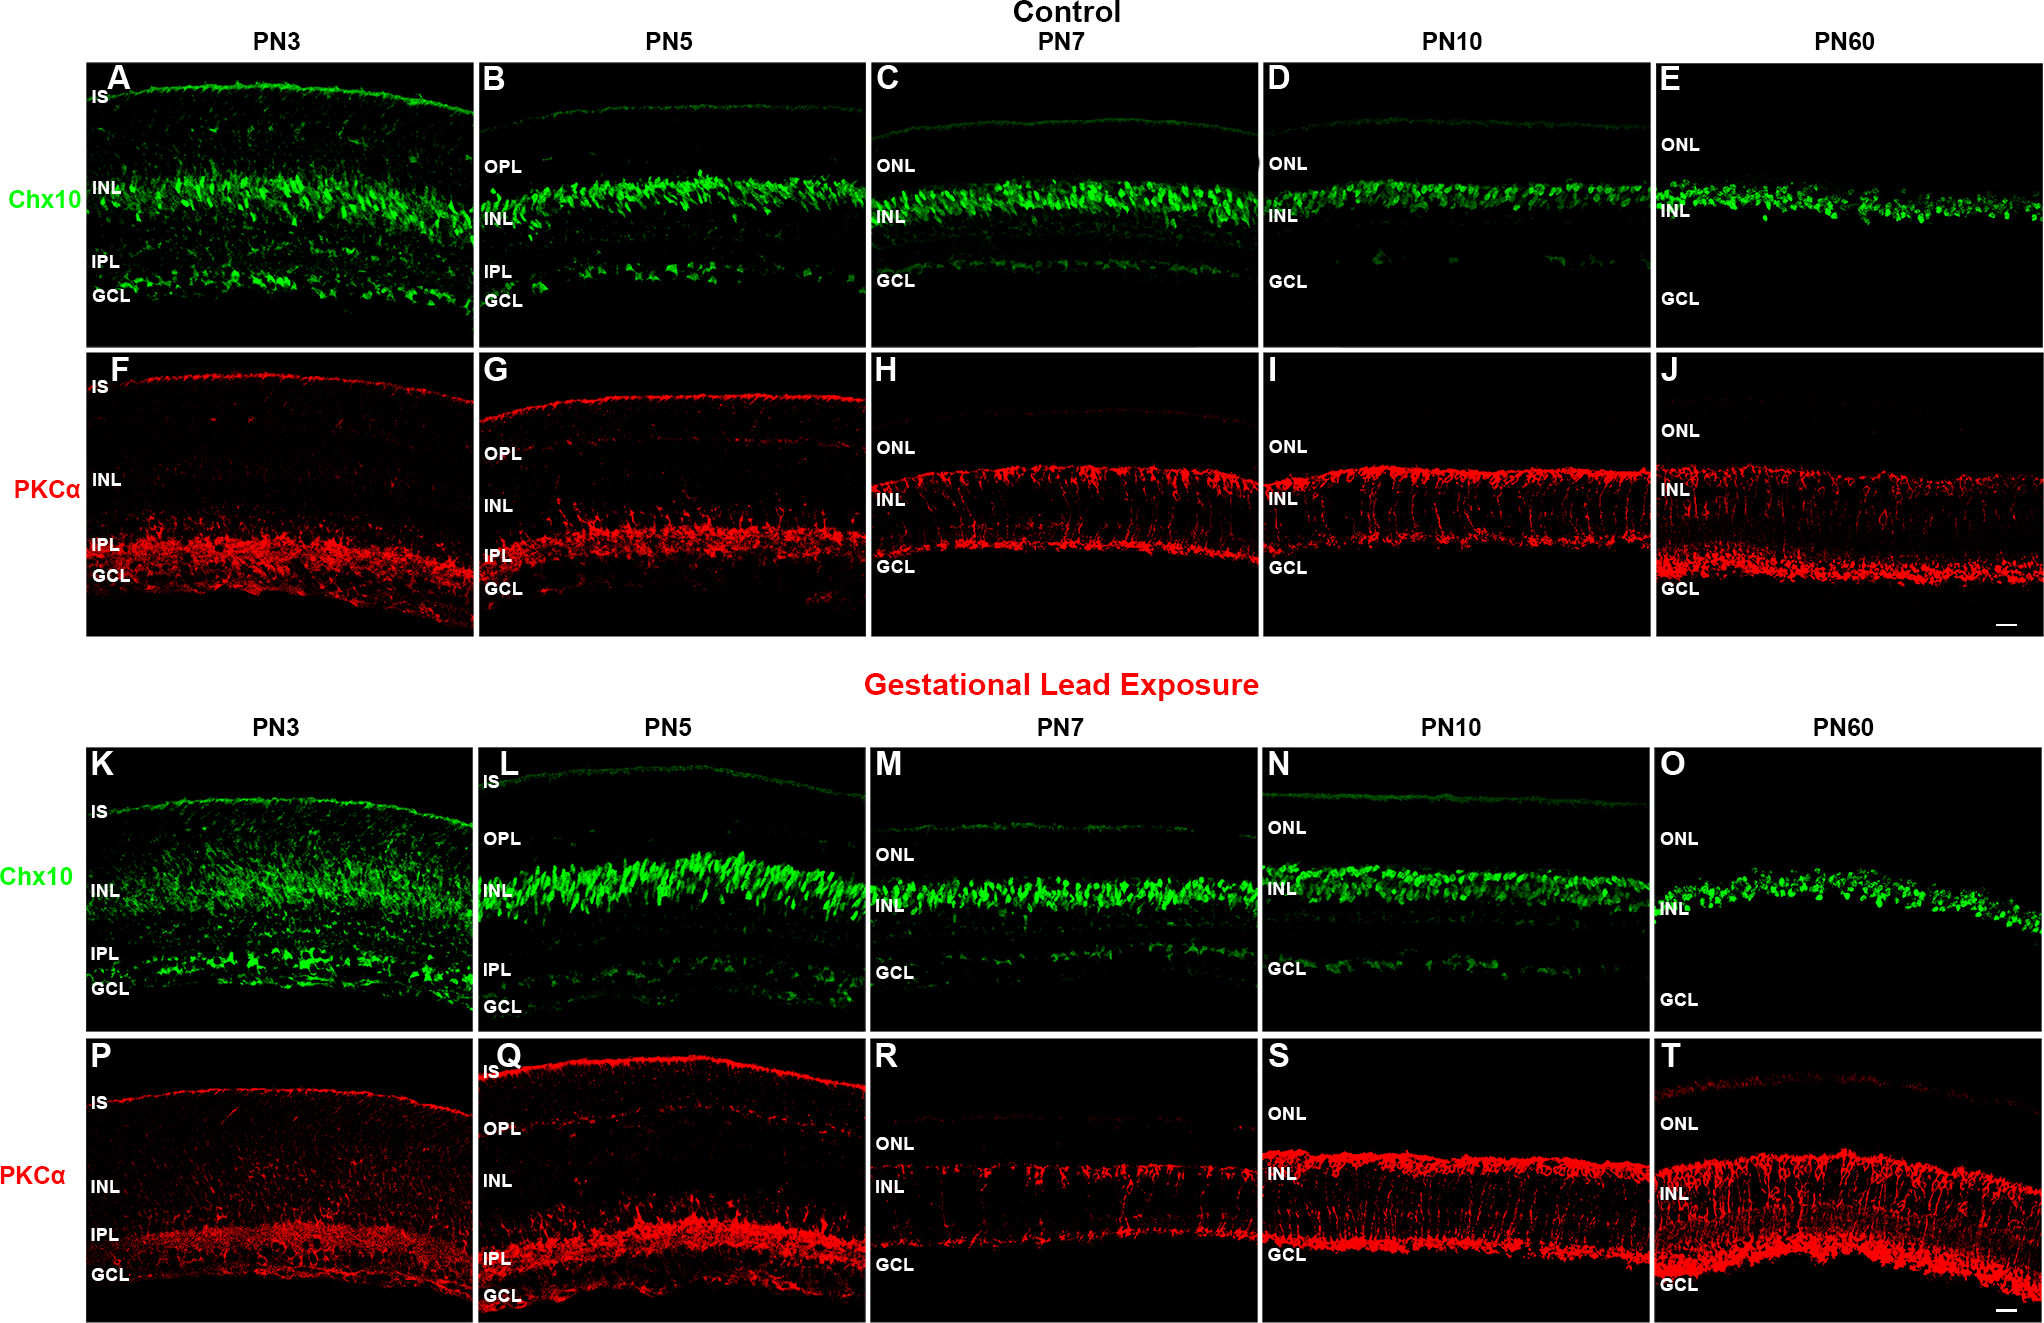
Figure 7. GLE delayed the differentiation of Chx10-IR and PKCα-IR BCs. The developing retinas from (
A–J) the control and (
K–T) GLE mice were double labeled with antibodies against
Chx10 (green:
A–E and
K–O) and PKCα (red:
F–J and
P–T)
A: In the PN3 controls,
Chx10 labeled both the proliferative and the newly differentiated BCs in the INL, as denoted by diffuse and intense labelin,g respectively,
as well as cells in the GCL.
B: At PN5 and (
C) PN7,
Chx10 labeled differentiated BCs in the INL as well as cells in the GCL. For confirmation,
Figure 8 shows
Chx10 and CCND1, a cell cycle marker, labeling at PN1 and PN5. At PN7, a well-defined OPL was visible.
D and
E: The patterns at PN10 and PN60 was similar to that at PN7.
K: In contrast, in the PN3 GLE retinas,
Chx10 labeled only proliferative cells, and no differentiated
Chx10-IR BCs were present.
L: At PN5,
Chx10-IR BCs were present, although they were spindle-shaped compared to the age-matched controls.
M: At PN7, the patterns were similar in the control and GLE retinas.
N and
O: At PN10 and PN60, there were significantly more
Chx10-IR cells in the GLE retinas, as described [
21].
F: In the PN3 control retinas, PKCα-IR was in ISs, the IPL, and the GCL.
G: At PN5, PKCα-IR increased in the ISs, IPL, and GCL and appeared in the OPL.
H: At PN7, PKCα-IR was selectively and intensely expressed in the rod BCs, from their dendrites in the OPL and to their axon
terminals in the most proximal INL.
I: At PN10, the rod BCs continued to develop, as evidenced by the increased extent of the PKCα-IR.
J: At PN60, PKCα-IR labeled the complete mature rod BC.
P: In the PN3 GLE retinas, PKCα-IR was less intense and more diffuse than in the age-matched controls, as seen in the ISs, IPL,
and GCL.
Q and
R: At PN5 and PN7, the GLE retinas were similar to the controls. However, the OPL was less developed, and fewer PKCα-IR rod
BCs were present.
S: At PN10, the BCs in the GLE increased in their number and thickness.
T: In PN60, the BC number and thickness increased in the GLE retinas relative to the age-matched controls, as described [
21]. Thus, GLE delayed the appearance and localization of
Chx10 and PKCα (
Table 3). Scale bar = 40 μm. GLE= Gestational lead exposure; IR = immunoreactive; BC = bipolar cell; PN = postnatal; INL = inner
nuclear layer; GCL = ganglion cell layer; CCND1 = cyclin D1; OPL = outer plexiform layer; IPL = inner plexiform layer.
 Figure 7 of
Chaney, Mol Vis 2016; 22:1468-1489.
Figure 7 of
Chaney, Mol Vis 2016; 22:1468-1489.