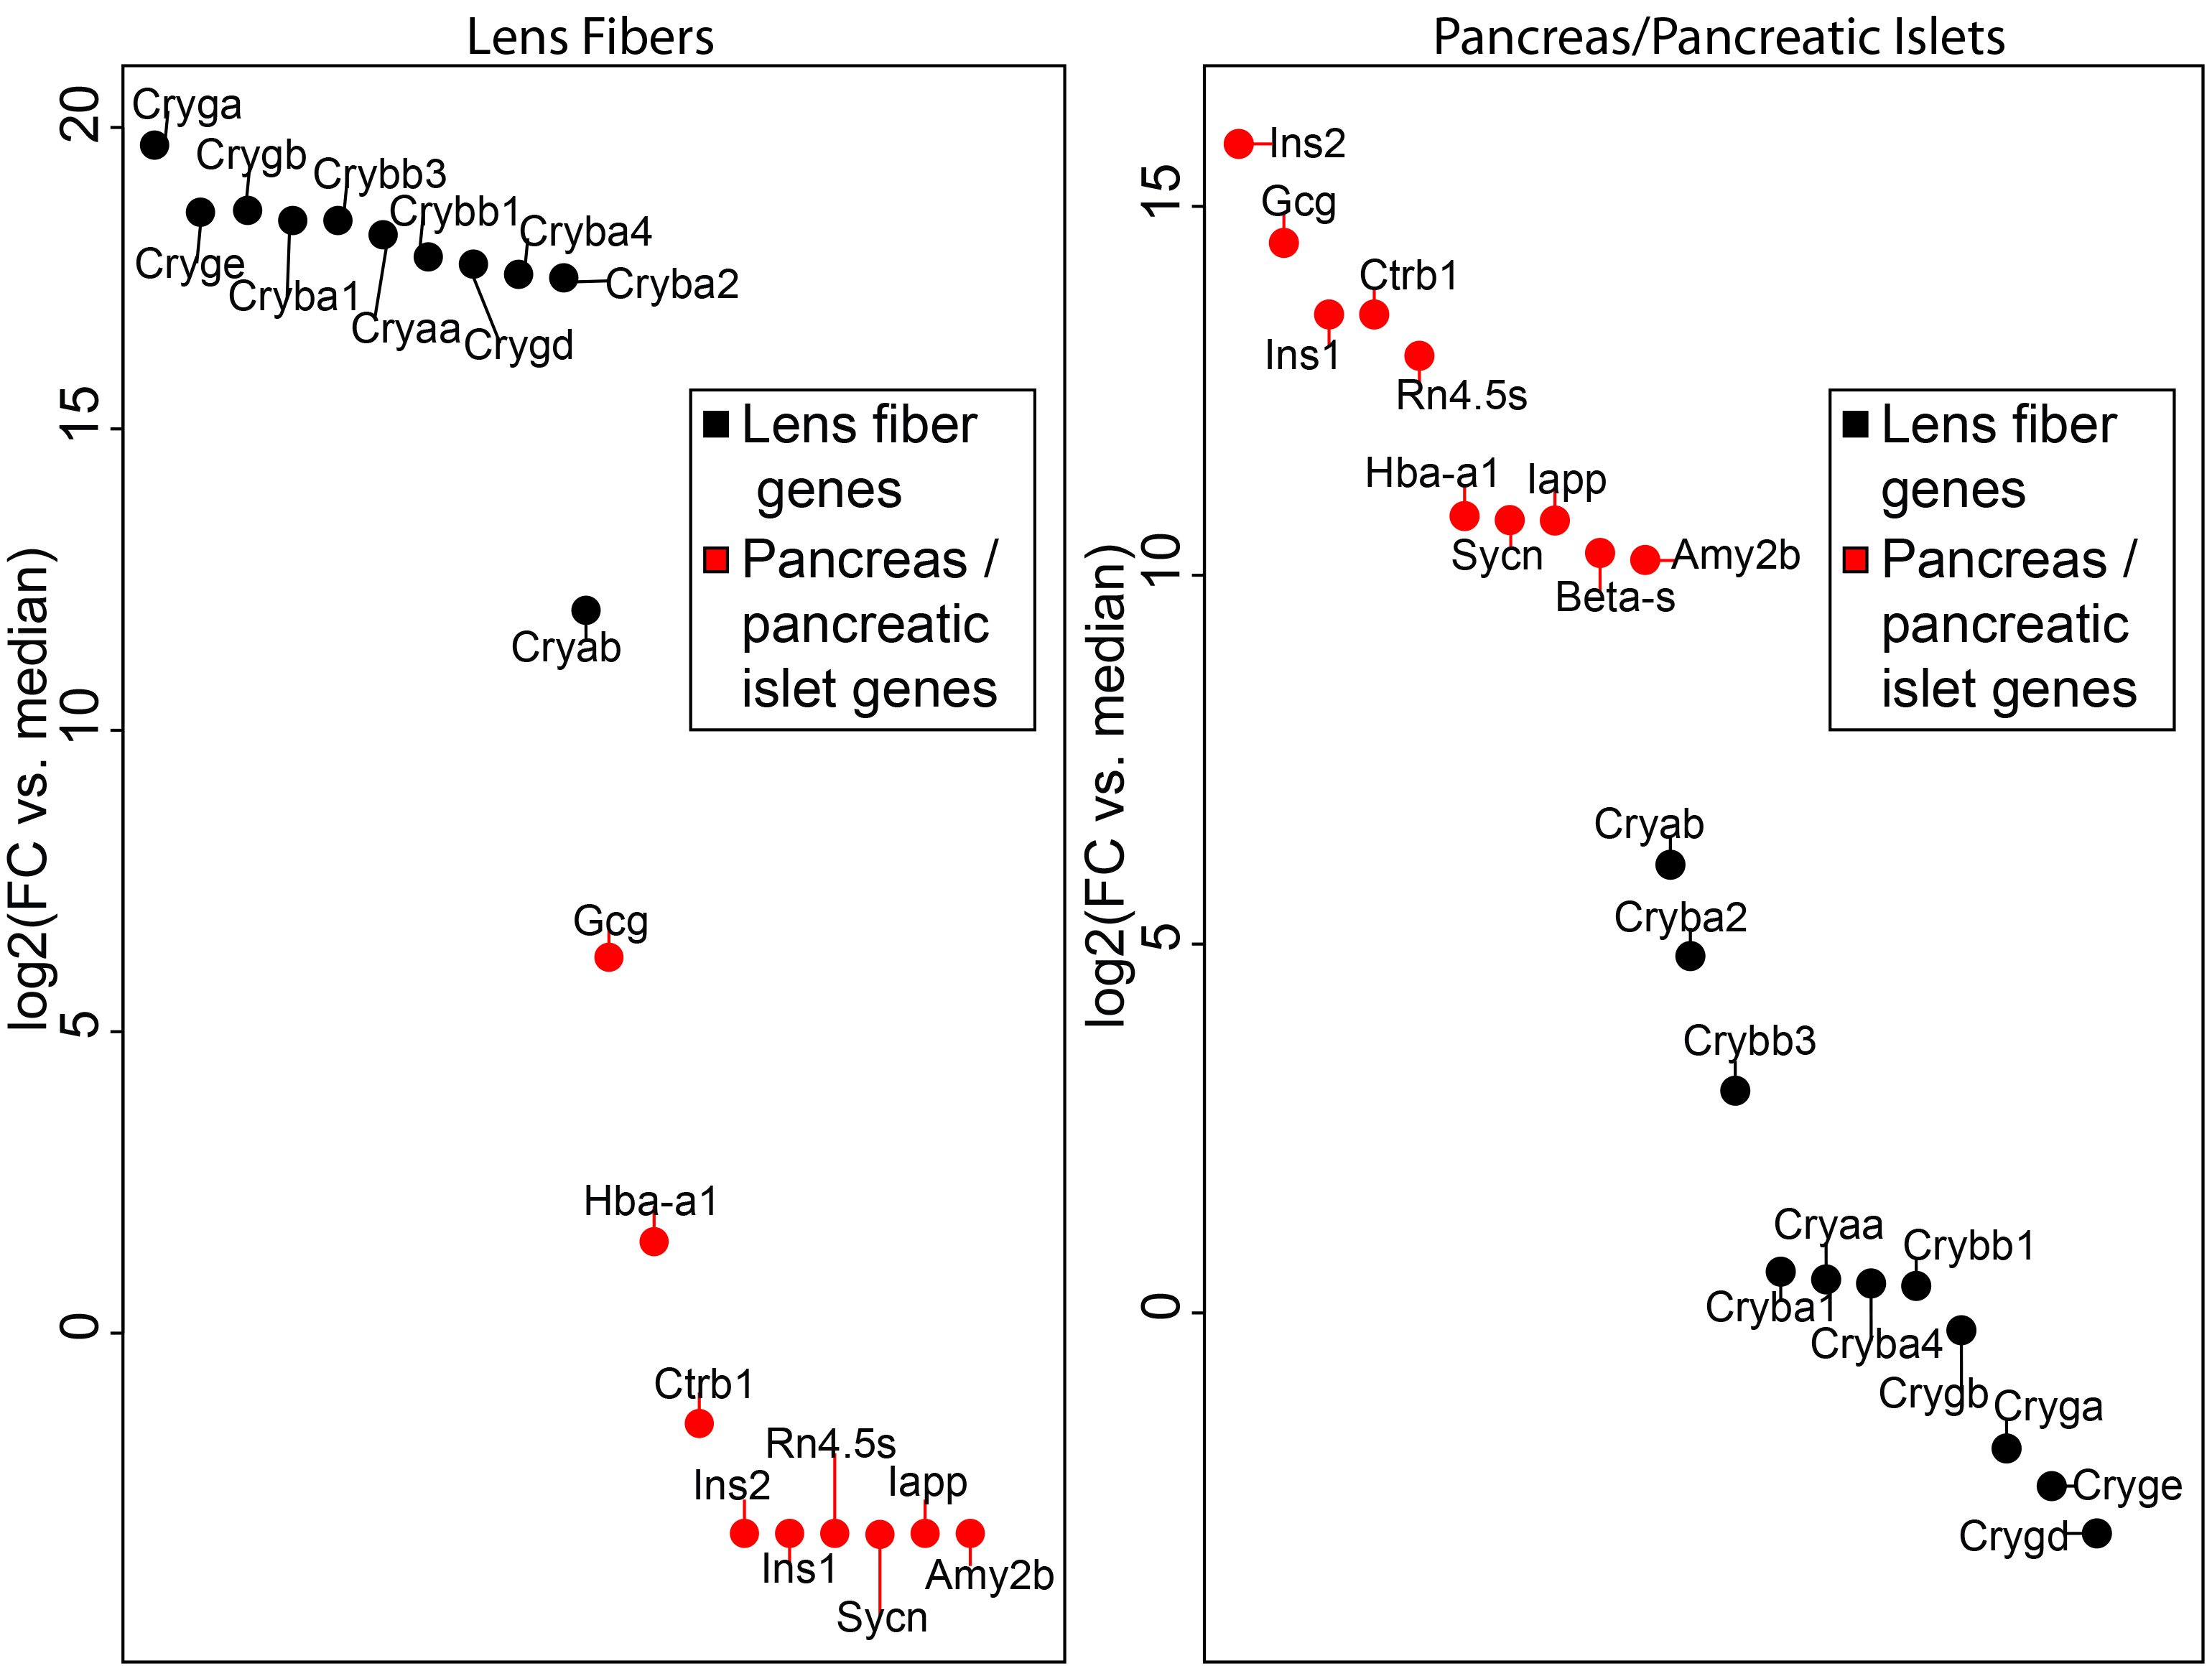
Figure 2. Gene expression comparison between lens fibers and pancreas/pancreatic islets.
A: Visualization of expression levels of top expressed genes in lens fibers (n=10, Cryab also included as it is the most abundant
crystallin in the pancreas, black circles) and pancreas genes (red circles).
B: Expression levels of top expressed genes in the pancreas (n=10, red circles) and lens crystallins (black circles). The data
were calculated as described in the legend for
Figure 1.
 Figure 2 of
Sun, Mol Vis 2015; 21:955-973.
Figure 2 of
Sun, Mol Vis 2015; 21:955-973.