Figure 1. Top expressed genes in terminally differentiated mammalian tissues and organs. The y-axis shows the relative expression levels
(versus the median expression level of protein coding genes in the tissue) of the top 10 expressed genes in each tissue. Individual
colored dots represent transcripts from different tissues: erythrocytes (black), liver (green), neurons (light blue), forebrain
(purple), lens epithelium (yellow), lens fibers (gray), and pancreas/pancreatic islets (dark blue). Hbb-bs (βS-globin, adult s chain), Hbb-b1 (βA-globin adult major chain), Cryga (γA-crystallin), Hbb-b2 (βA-globin adult minor chain), Hbb-bt (βA-globin adult t chain), Cacna2d1 (calcium channel, voltage-dependent, α2/δ subunit 1), Cryge (γE-crystallin), Crygb (γB-crystallin),
Hba-a2 (αA-globin adult chain 2), Cryba1 (βA1-crystallin), Crybb3 (βB3-crystallin), Cryaa (αA-crystallin), Crybb1 (βB1-crystallin),
Crygd (γD-crystallin), Cryba4 (βA4-crystallin), Cryba2 (βA2-crystallin), Ins2 (insulin II), Gcg (glucagon), Ins1 (insulin
I), Ctrb1 (chymotrypsinogen B1), Ahsg (α-2-HS glycoprotein), Trf (transferrin), Rn4.5s (4.5S RNA), Apoe (apolipoprotein E),
Apoa1 (apolipoprotein A-1), Hist1h4d (histone cluster 1, H4d), mt-Co2 (cytochrome c oxidase II, mitochondrial), Hist2h2bb
(histone cluster 2, H2bb), Hbb-y (hemoglobin Y, β-like embryonic chain), Hist4h4 (histone cluster 4, H4), Sparc (osteonectin),
Rprl3 (RNase P RNA-like 3), Rn45s (45S pre-rRNA), Col4a1 (collagen, type IV, alpha 1), Col4a2 (collagen, type IV, alpha 2),
and Pga5 (pepsinogen 5, group I).
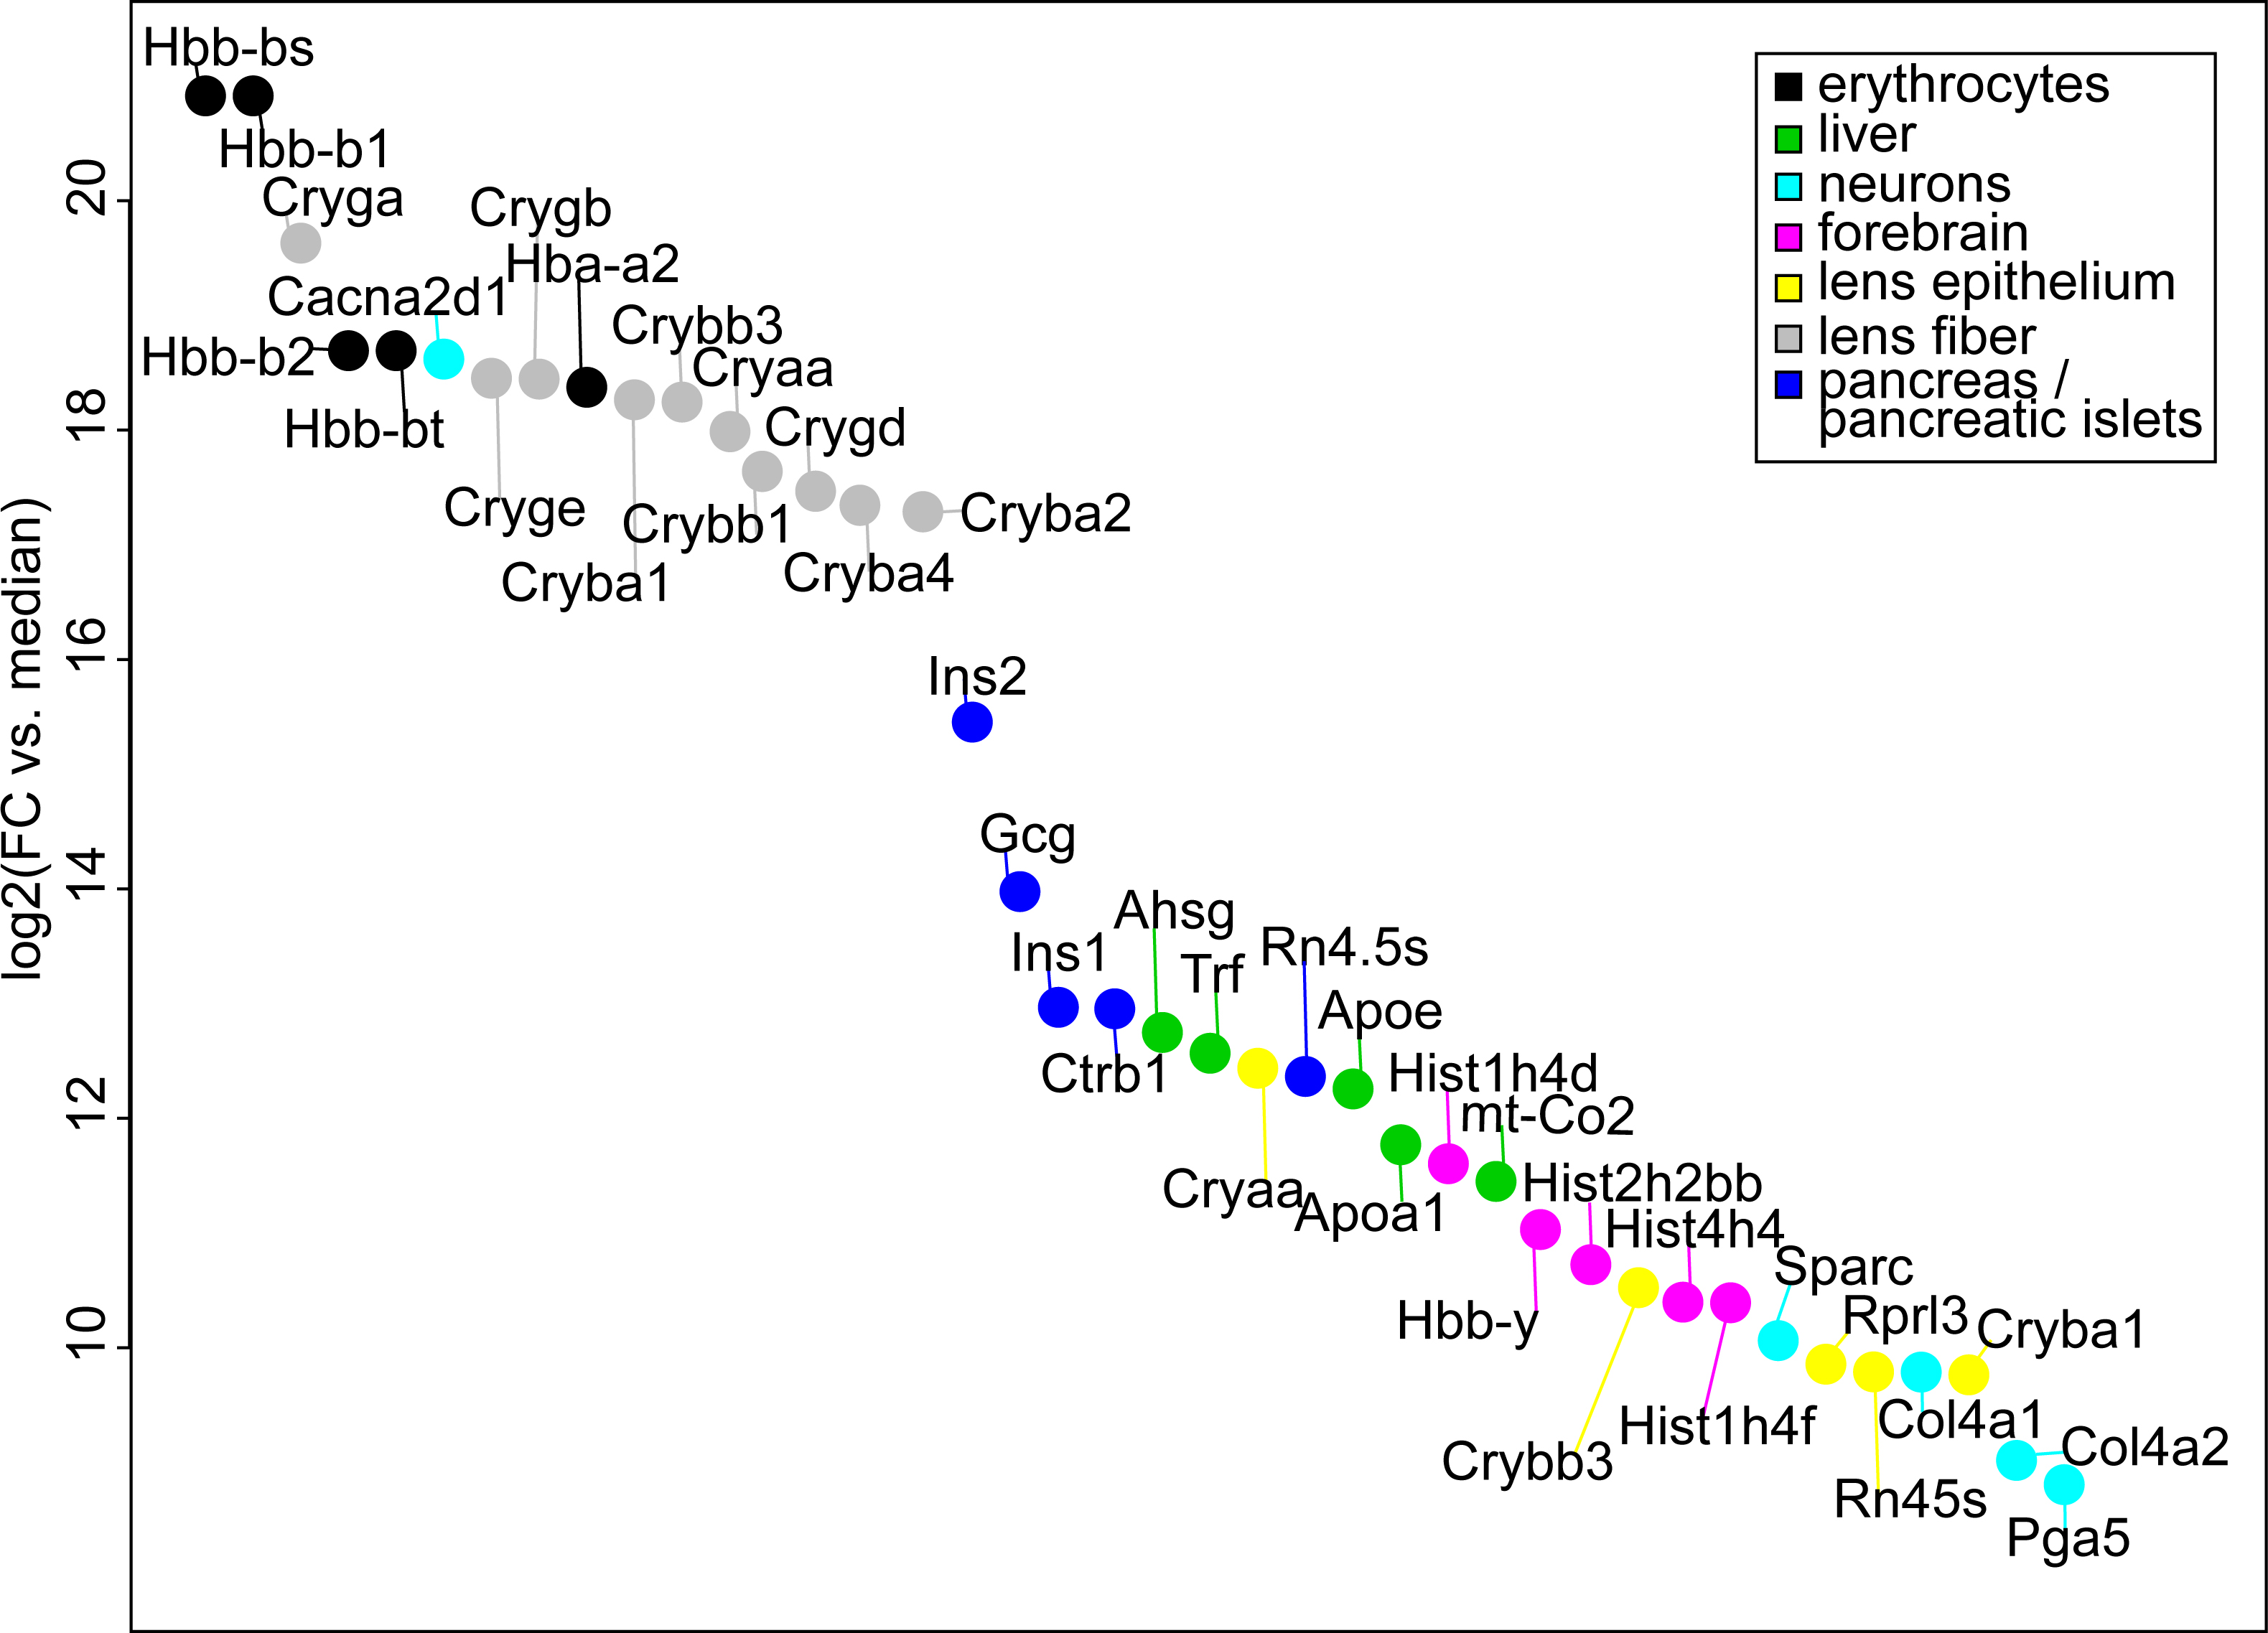
 Figure 1 of
Sun, Mol Vis 2015; 21:955-973.
Figure 1 of
Sun, Mol Vis 2015; 21:955-973.