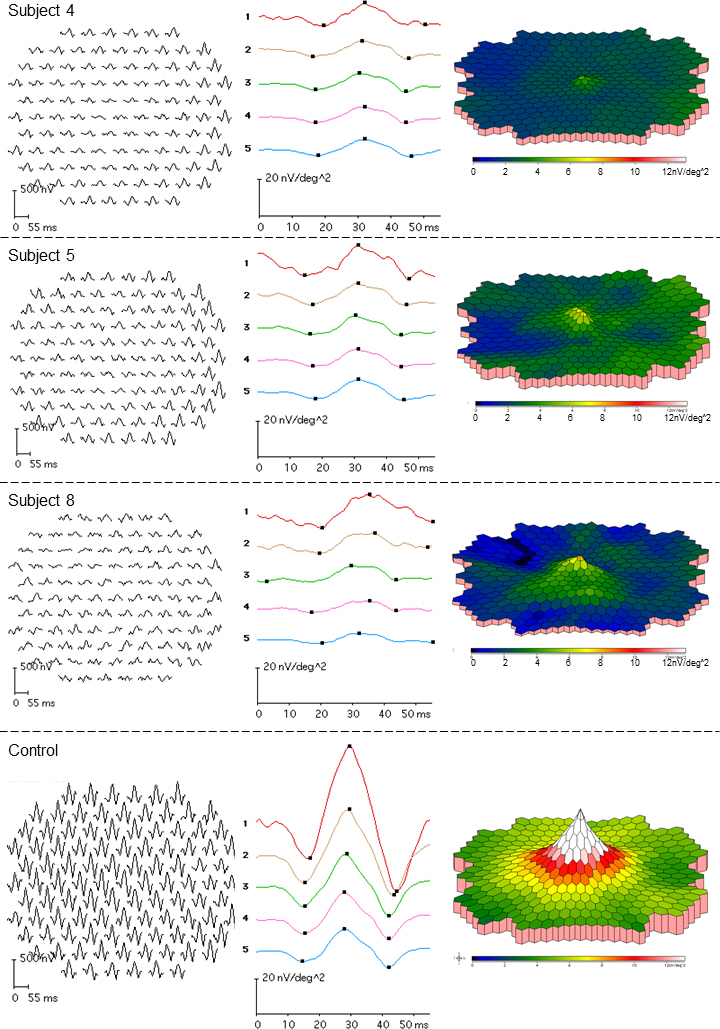
Figure 4. MERGs from three of the
ABCA4 carriers (subject 4, top row; subject 5, second row; and subject 8, third row). The bottom row illustrates a normal mERG
in one of the controls. Subject 4 has reduced mERG amplitudes and delayed ITs, although the fundus photos do not show any
changes. Subject 5 also has reduced mERG amplitudes and delayed ITs. In this subject, the mERG alterations are accompanied
by pigmentary changes in the macula (
Figure 1B, C). Subject 8 with quite widely spread retinal flecks (
Figure 1J, K) demonstrates delayed mERG ITs but normal mERG amplitudes.
 Figure 4 of
Kjellström, Mol Vis 2015; 21:767-782.
Figure 4 of
Kjellström, Mol Vis 2015; 21:767-782.