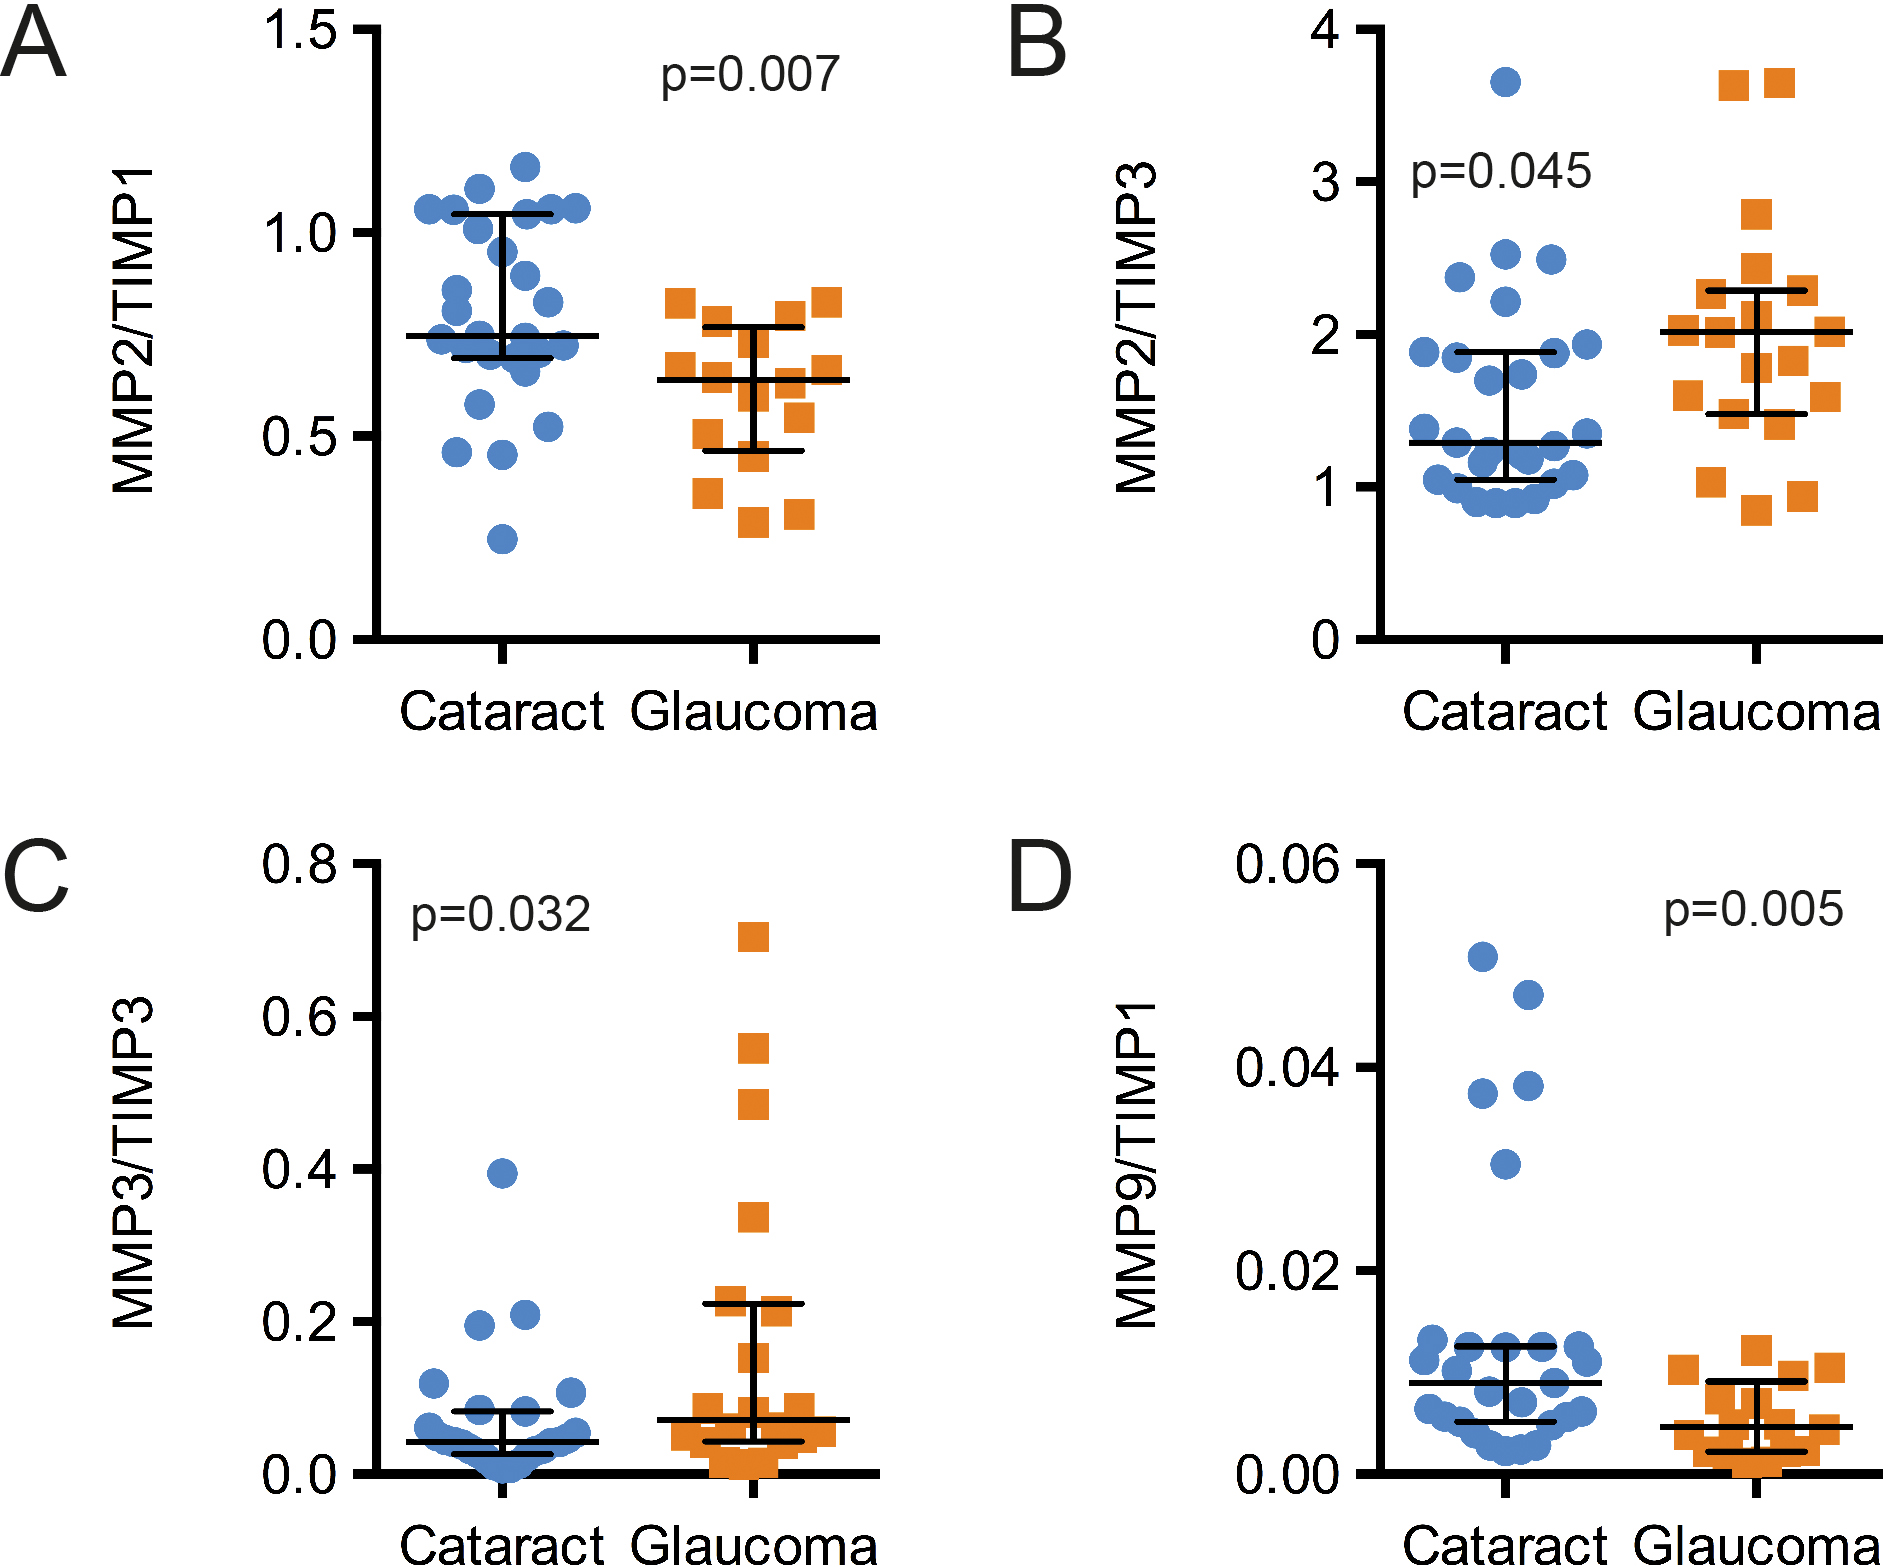
Figure 2. Distribution of MMP/TIMP ratios in cataract versus POAG patients. Stoichiometric ratios were calculated for individual aqueous
humor samples from non-glaucomatous cataract (blue; N=23-24) and POAG (orange; N=16-20) patients. Median ratios and interquartile
ranges are indicated. The ratios for MMP2/TIMP1 (
A), MMP2/TIMP3 (
B), MMP3/TIMP3 (
C), and MMP9/TIMP1 (
D) were significantly different between cataract and glaucoma (p<0.05) patients, as determined using the Mann–Whitney U test.
See
Table 3 for the full set of ratios calculated.
 Figure 2 of
Briggs, Mol Vis 2015; 21:1162-1172.
Figure 2 of
Briggs, Mol Vis 2015; 21:1162-1172.