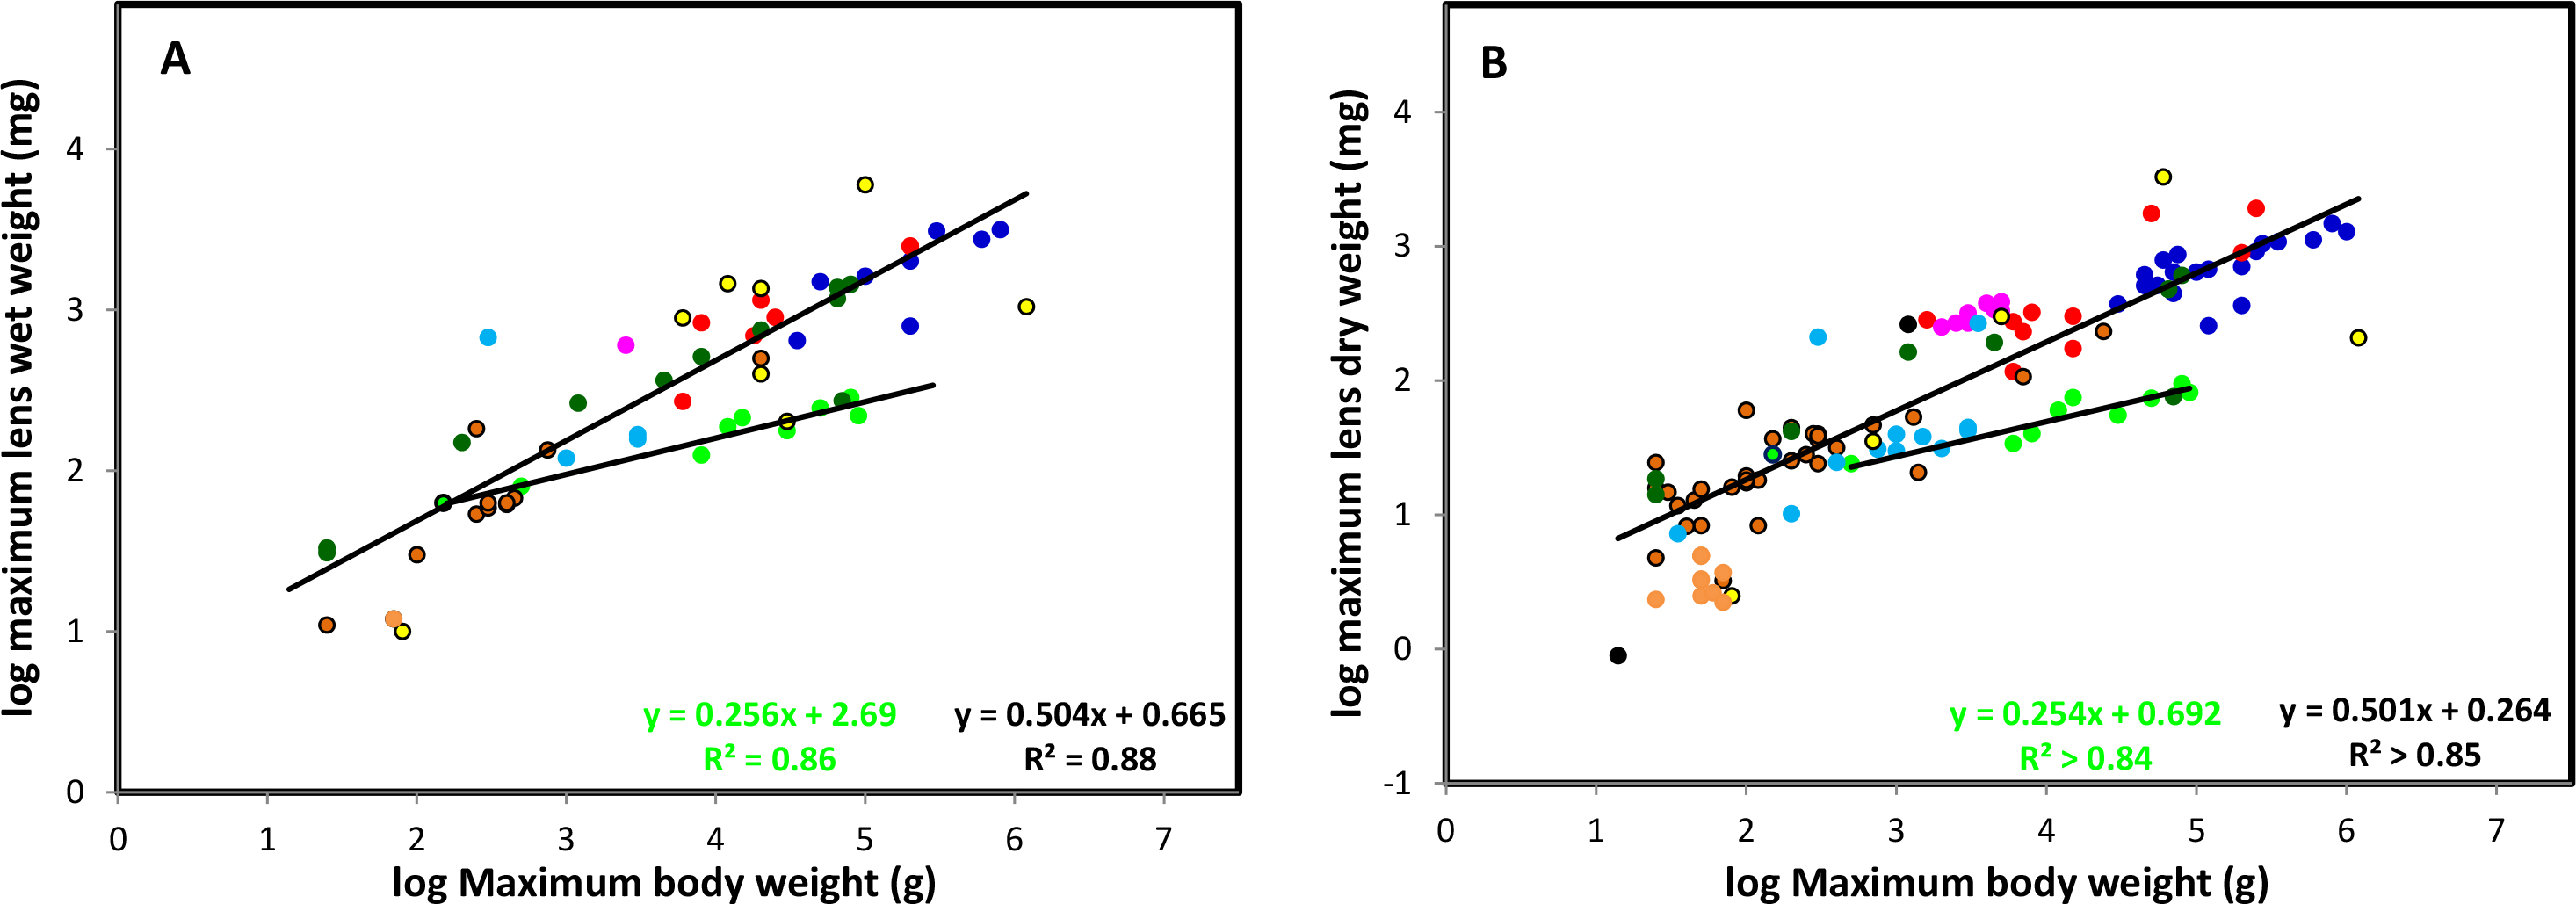
Figure 3. Allometric comparison of the relationship between maximum bodyweight and maximum lens wet and dry weights. Asymptotic lens
wet (
Figure 3A) and dry (
Figure 3B) weights were obtained from the logistic analysis described previously [
5] and from estimates described in
Table 2. Primate data were analyzed separately. Data for related species were grouped and colours were assigned to the groups – bats
(black), birds (light blue), carnivores (red), ectothermal species (reptiles, amphibians, fish, yellow with black outline),
lagomorphs (purple), marsupials (dark green), primates (light green), rodents (orange with black outline), tree shrew. (light
green with black outline) and ungulates (dark blue).
 Figure 3 of
Augusteyn, Mol Vis 2014; 20:427-440.
Figure 3 of
Augusteyn, Mol Vis 2014; 20:427-440.