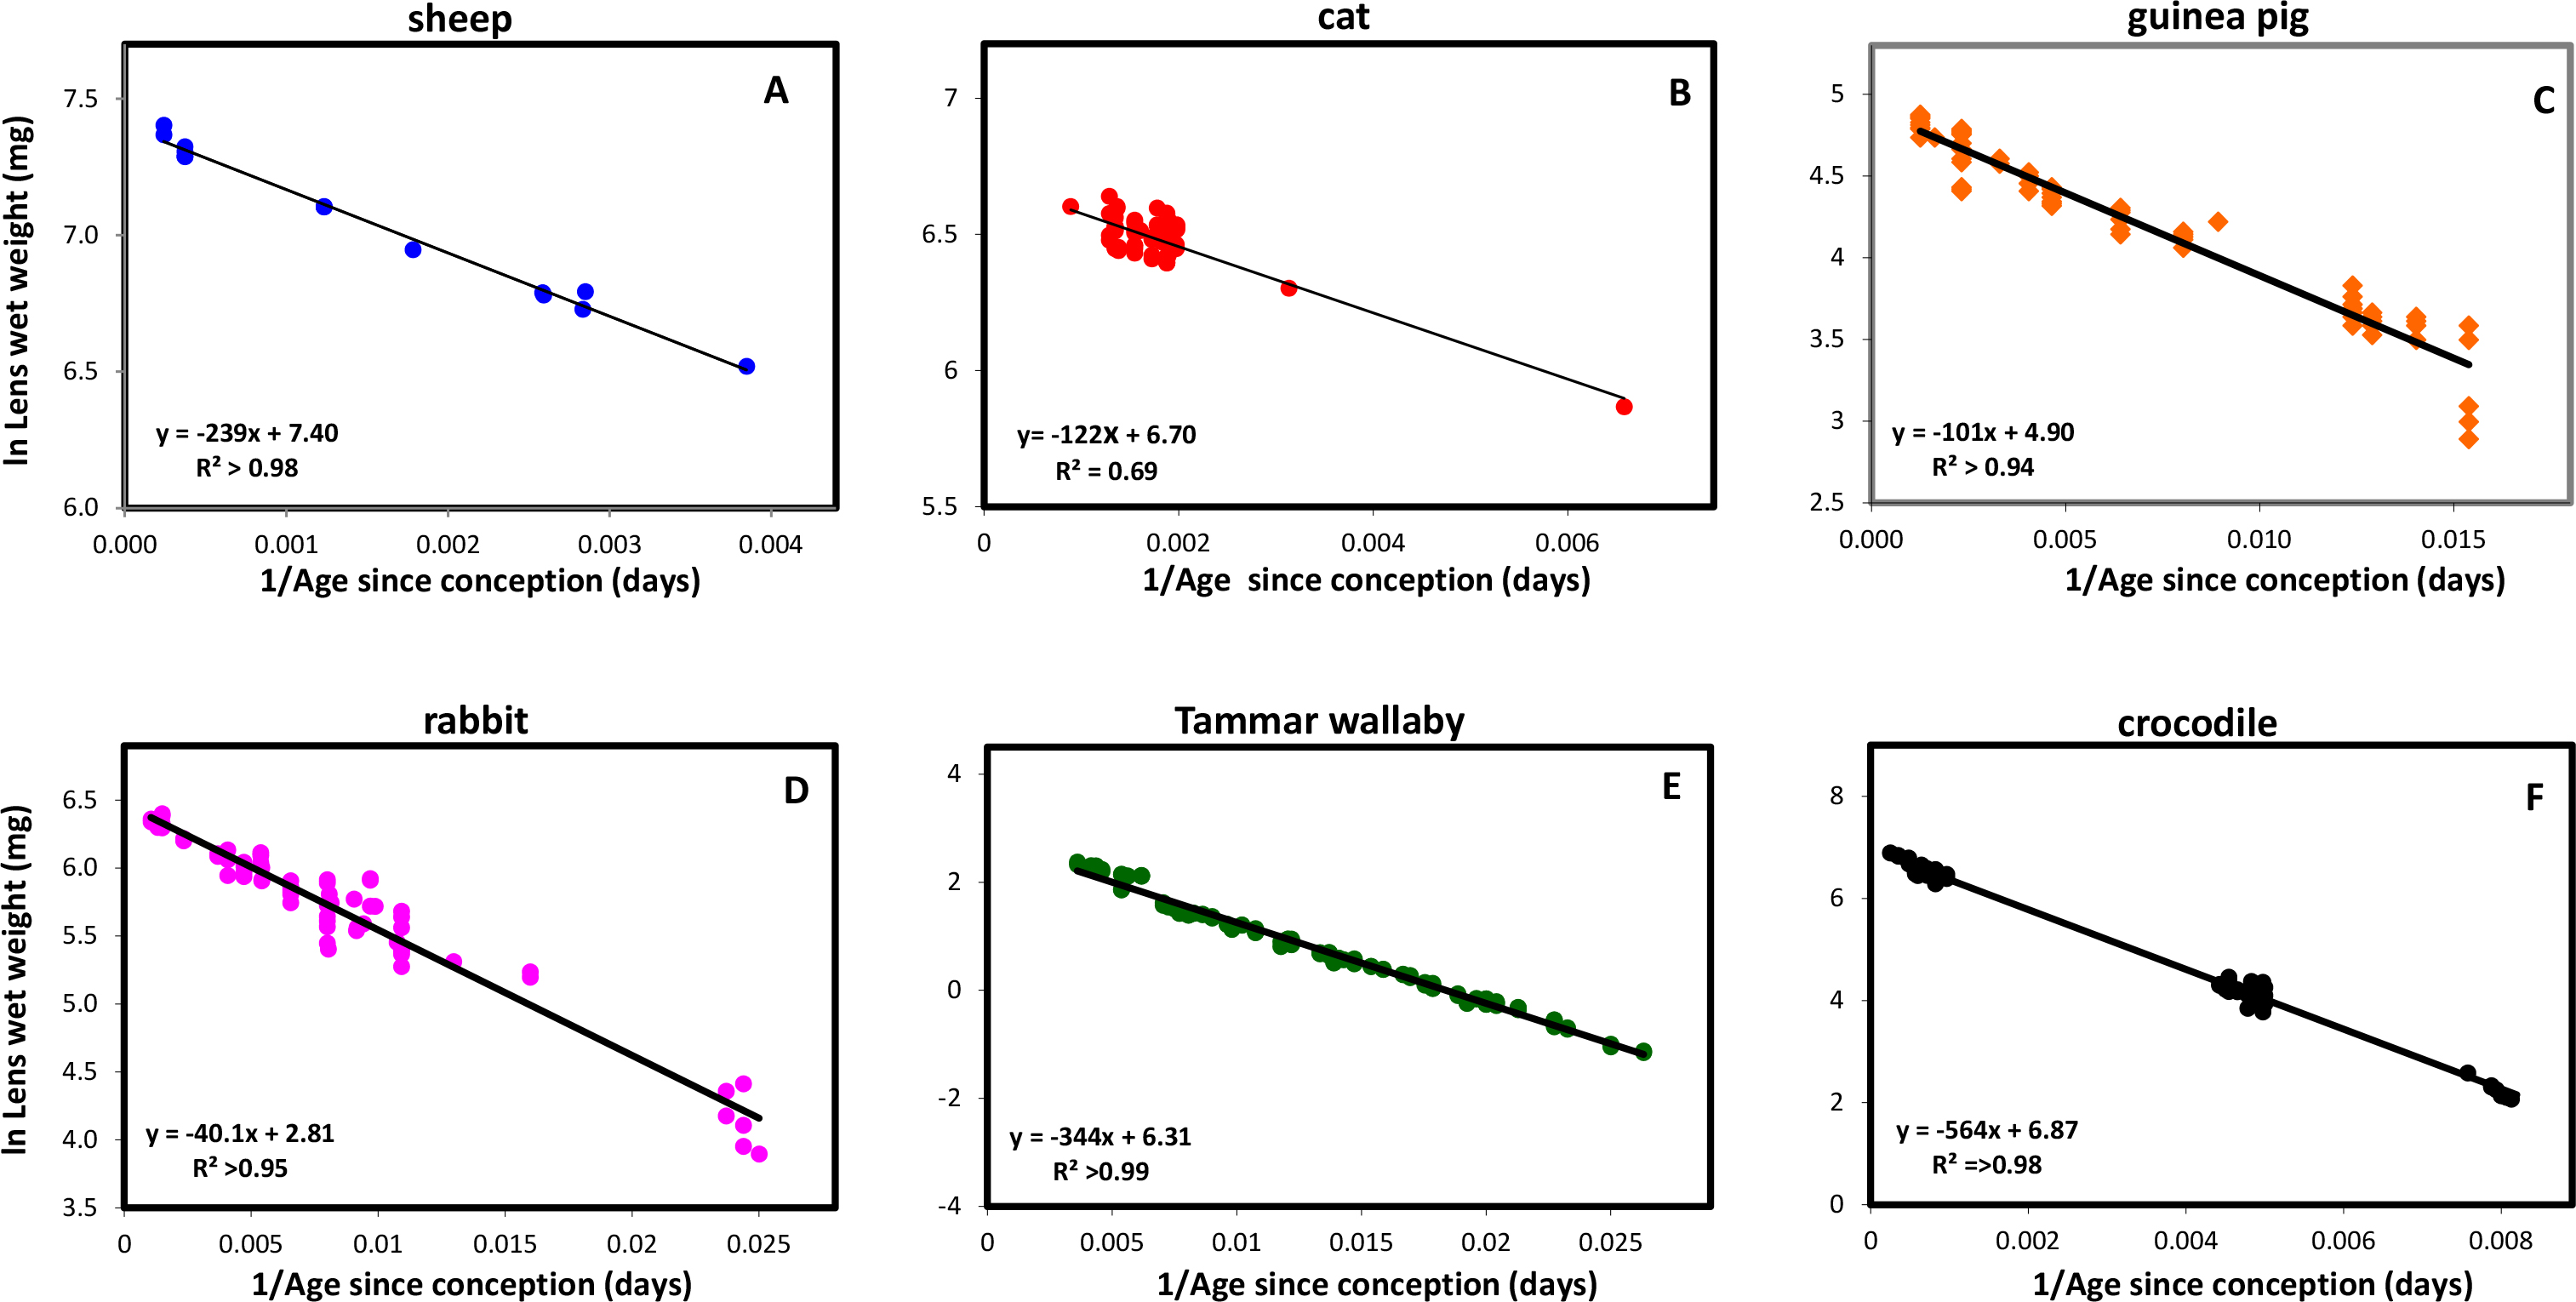
Figure 3. Logistic analysis of the changes in lens wet weight as a function of age. Data shown are for the species shown in
Figure 1: sheep (
A), cats (
B), guinea pigs (
C), rabbits (
D), Tammar wallabies (
E), and crocodiles (
F). Data sources are as indicated in Appendix 1.
 Figure 3 of
Augusteyn, Mol Vis 2014; 20:410-426.
Figure 3 of
Augusteyn, Mol Vis 2014; 20:410-426.