Figure 1. Changes in lens wet weight as a function of age. Weights are shown for (A) sheep (1,200 lenses or data), (B) cats (44), (C) guinea pigs (66), (D) rabbits (710), (E) Tammar wallabies (137), and (F) crocodiles (91). Color coding and the origins of the data are as indicated in the Methods section and Appendix 1.
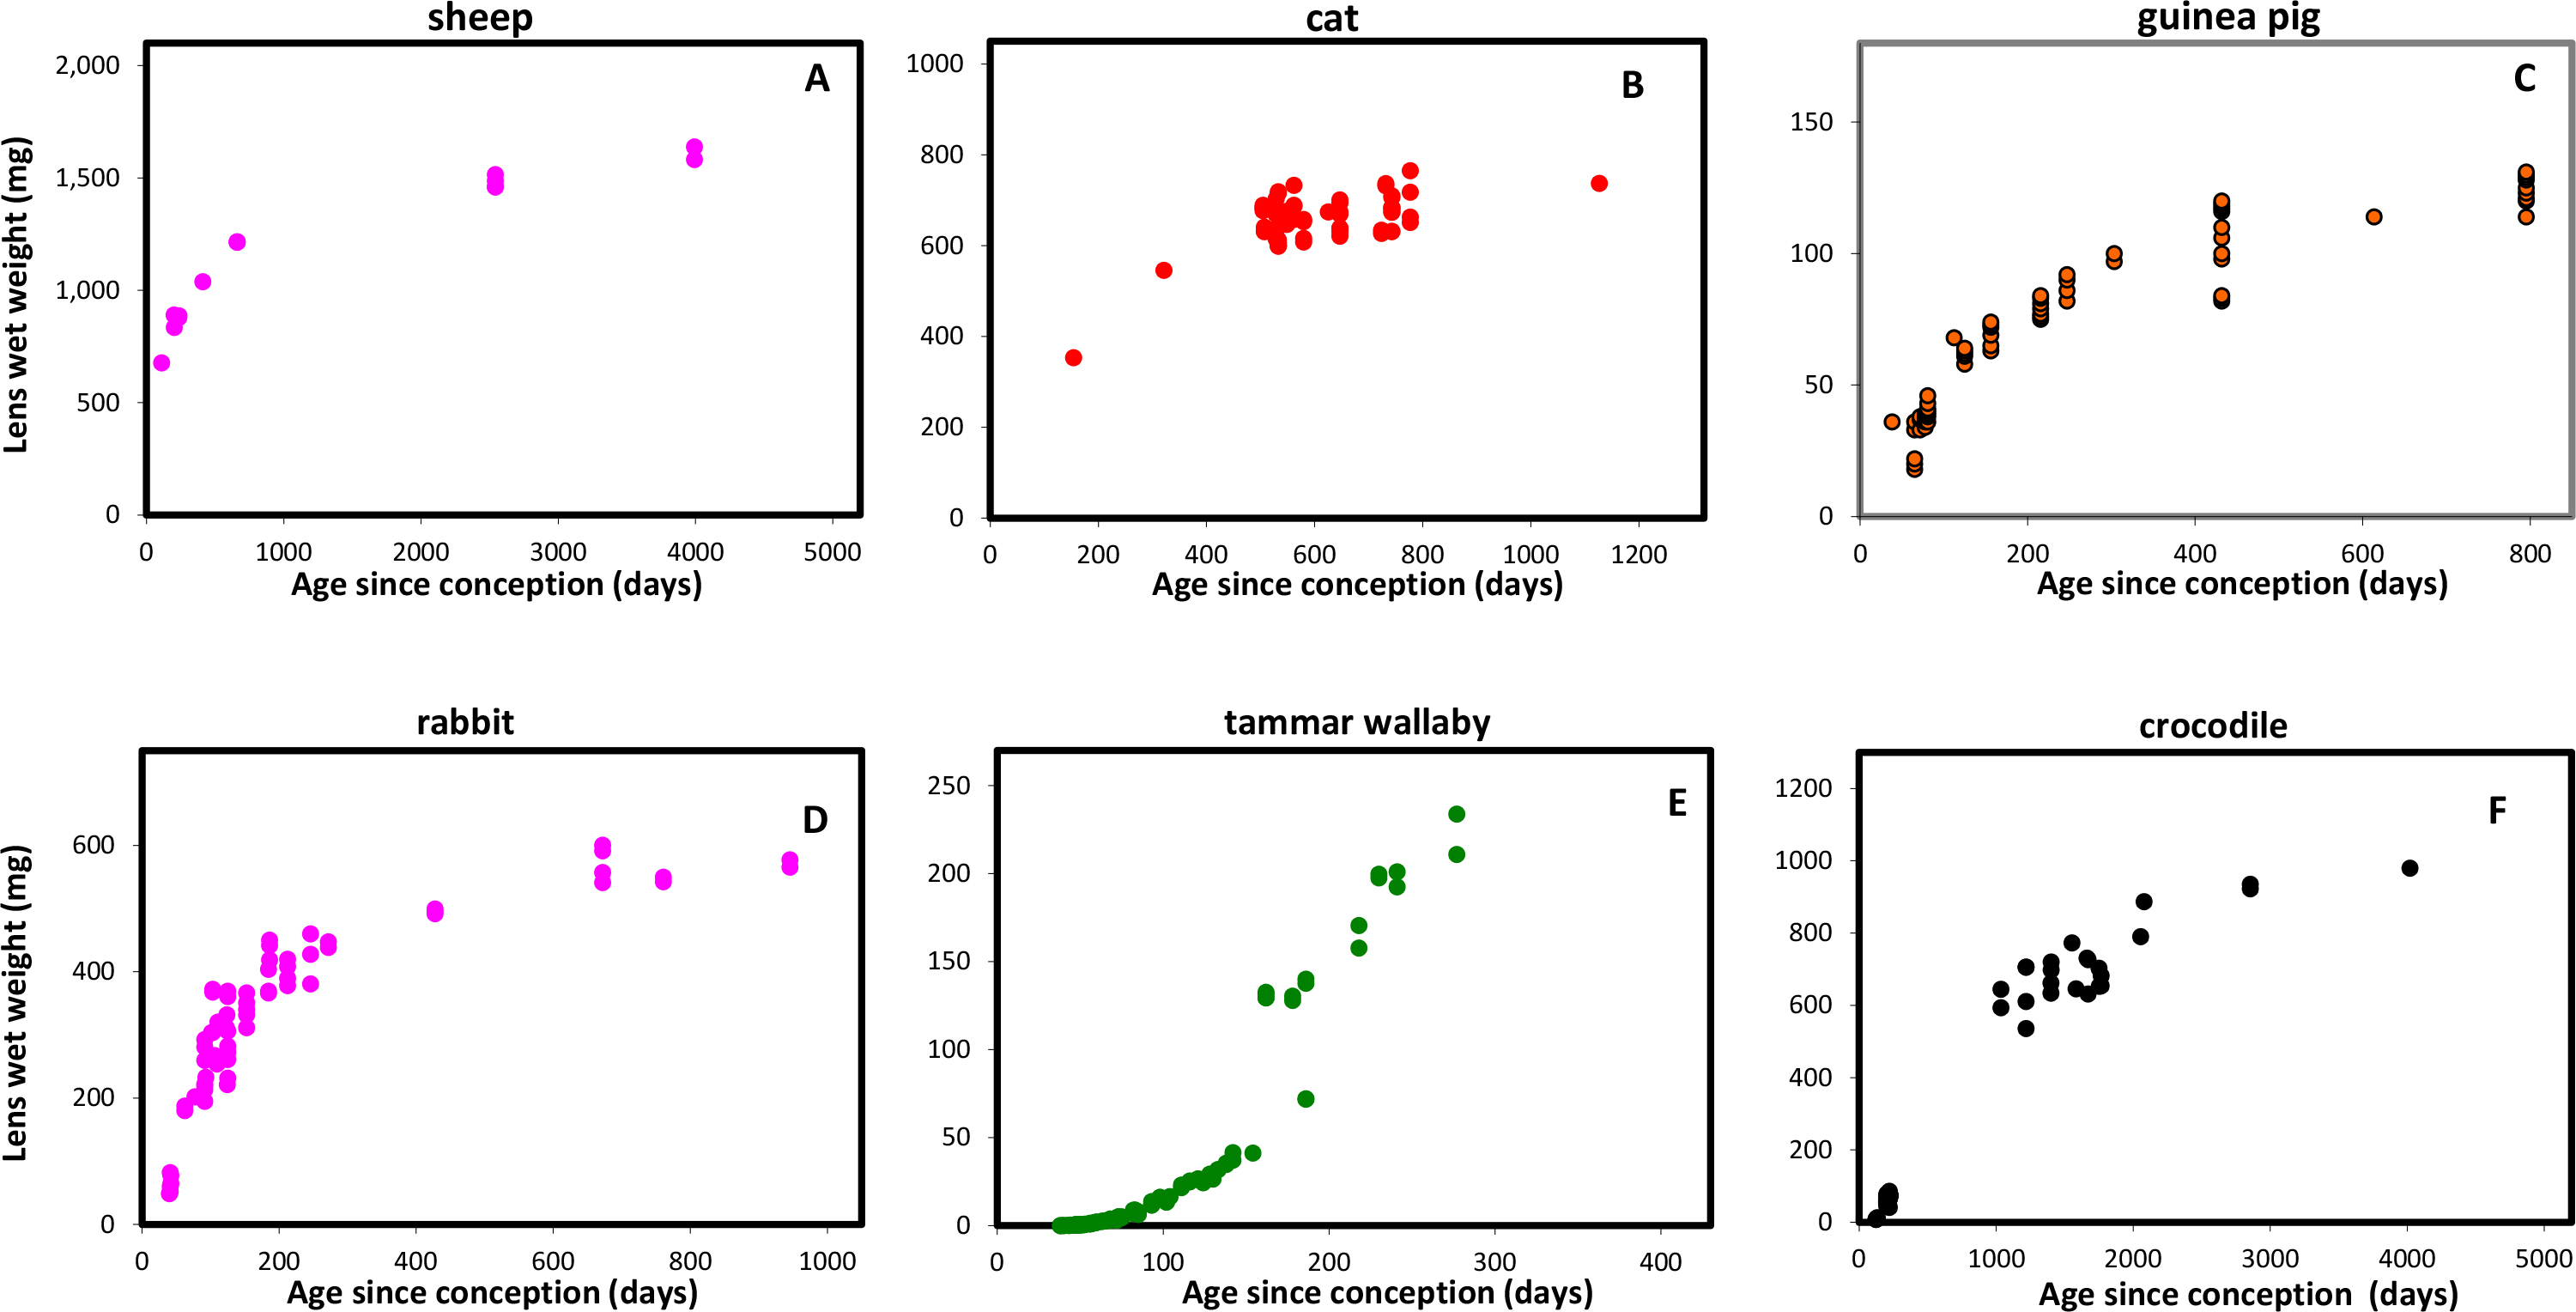
 Figure 1 of
Augusteyn, Mol Vis 2014; 20:410-426.
Figure 1 of
Augusteyn, Mol Vis 2014; 20:410-426.