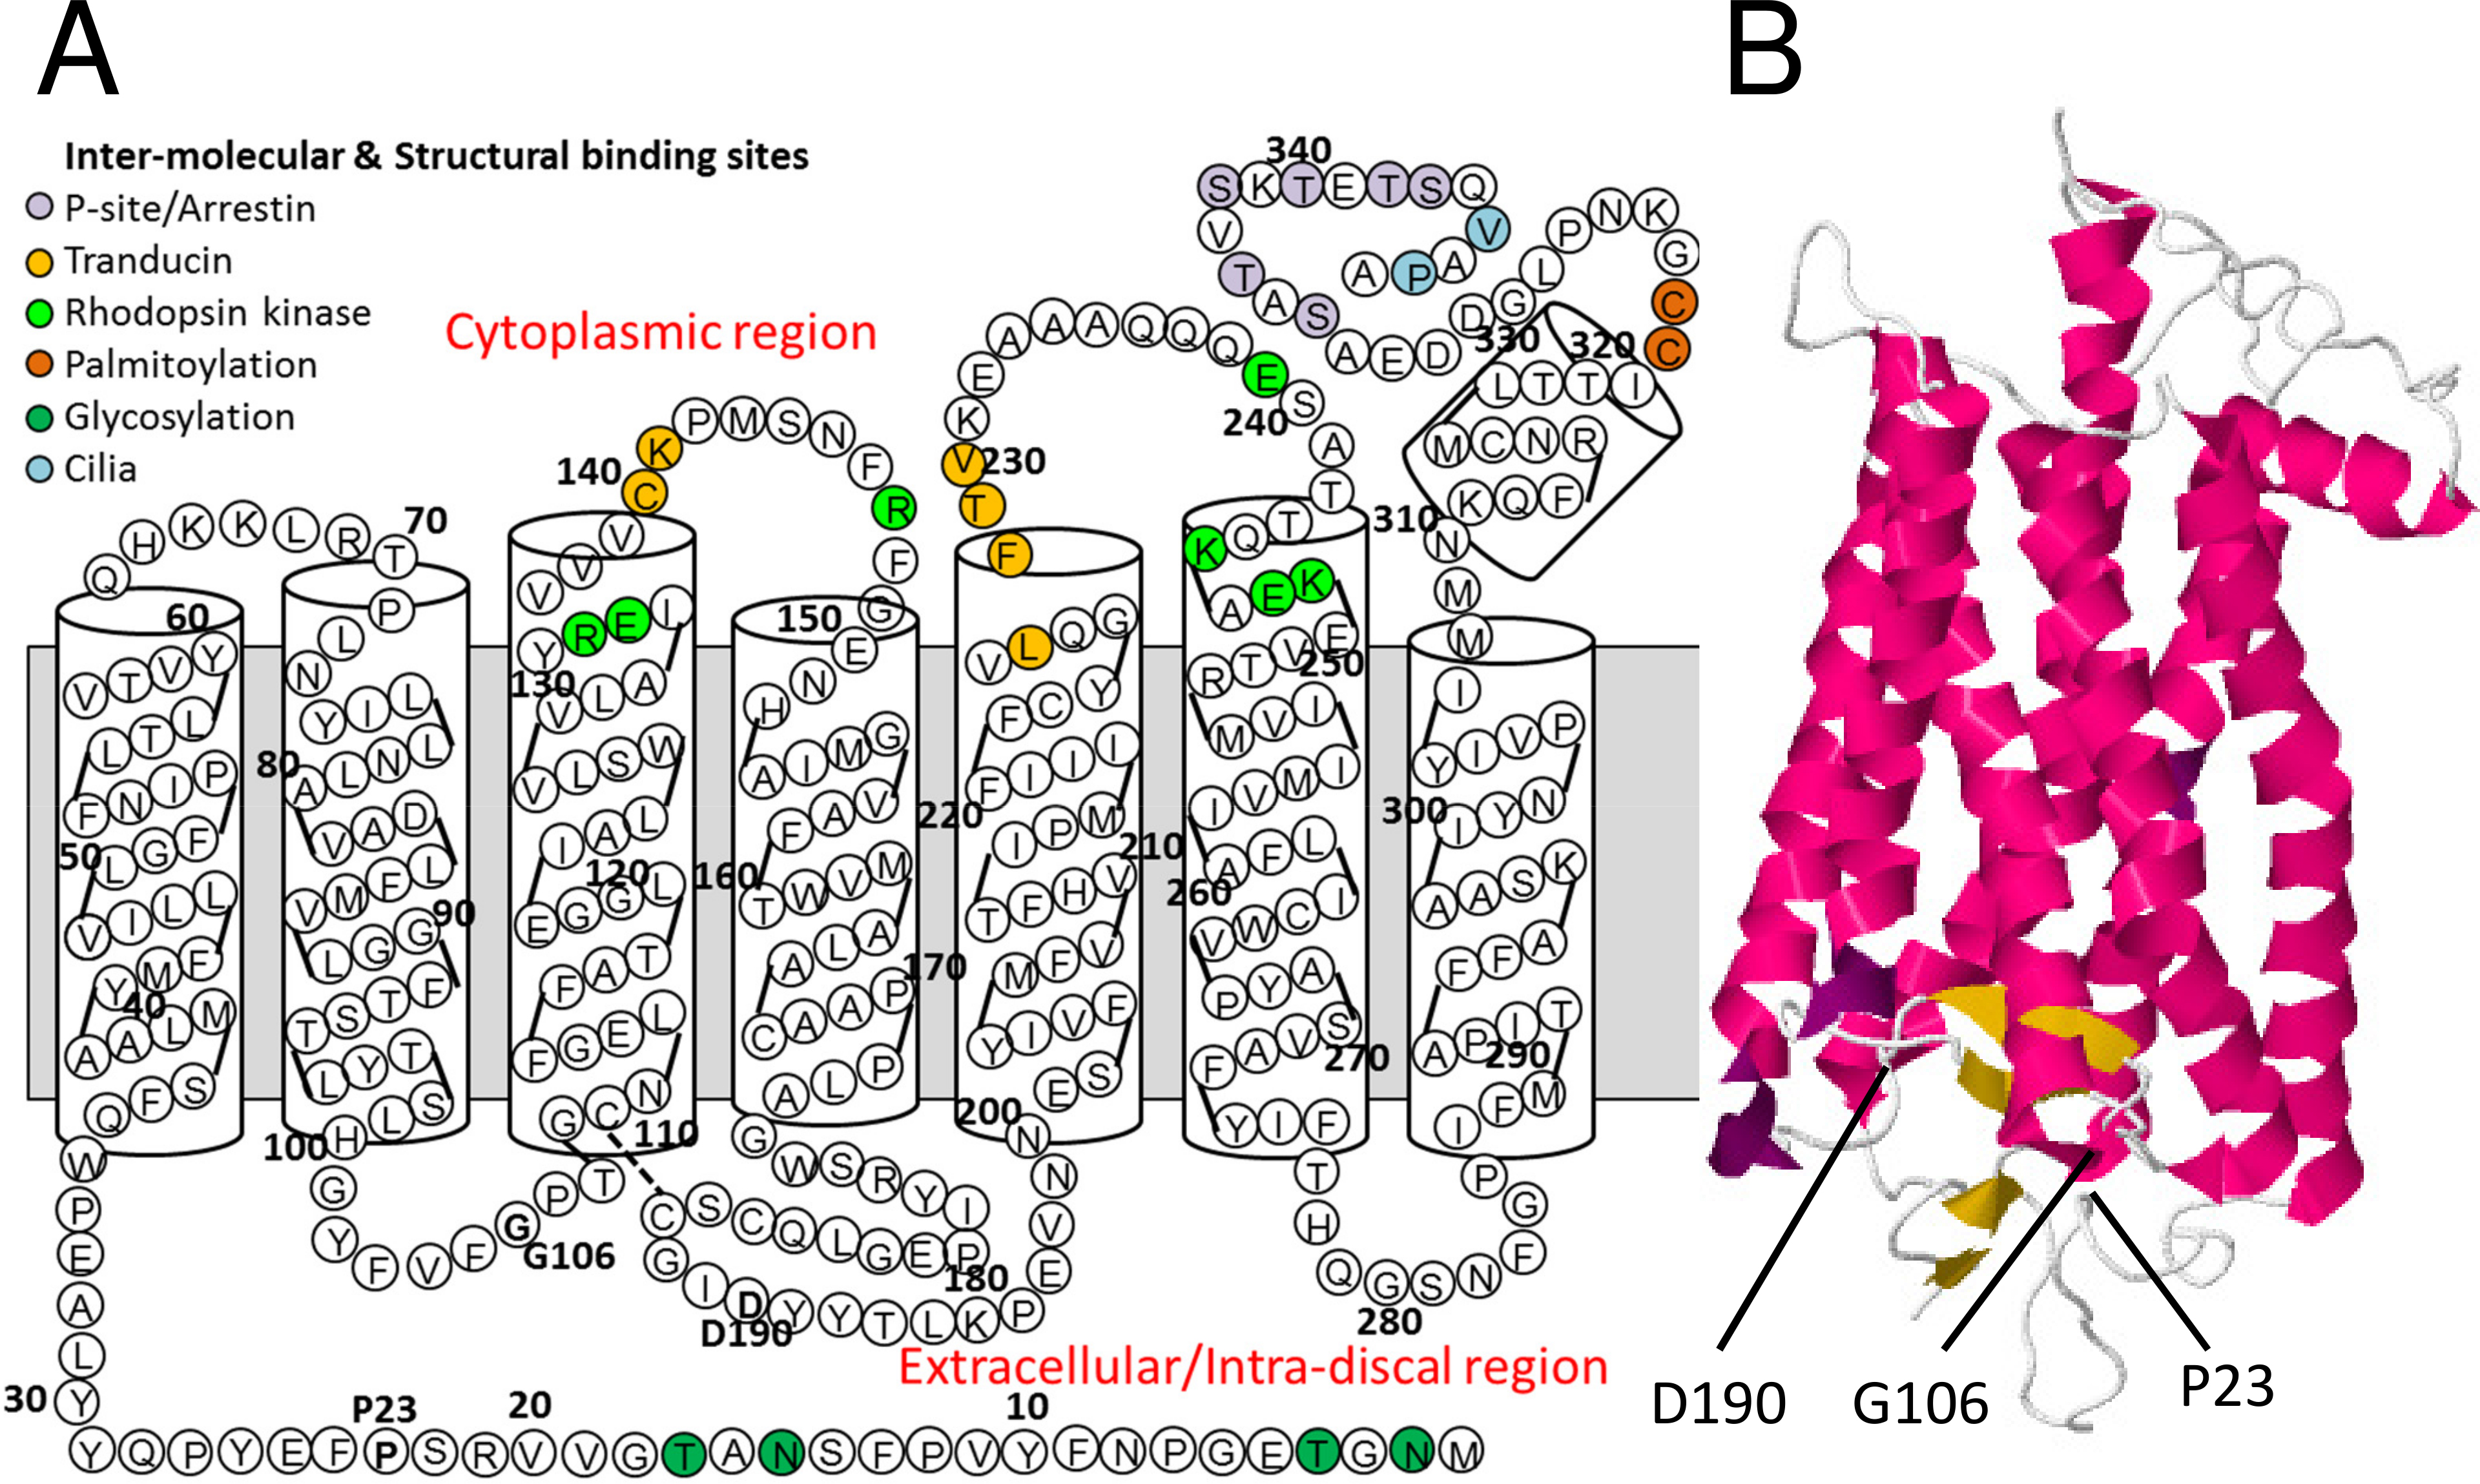
Figure 3. Rhodopsin structure.
A: The position of each residue within a regional schematic of the trans-membrane helices, intradiscal regions, and cytoplasmic
regions. Known specific residue functions are highlighted. The P23, G106, and D190 residues mutated by random site directed
mutagenesis are annotated in bold (adapted from Rakoczy and Kiel [
24]).
B: The structure of rhodopsin showing the relative positions of the three residues mutagenized for in vitro analysis of surface
expression, as determined with X-ray crystallography (
RCSB reference
1U19 strand A, viewed using JMol).
Figure 3A was adapted from a figure previously published in the
Journal of Molecular Biology [
24], Copyright Elsevier.
 Figure 3 of
McKeone, Mol Vis 2014; 20:183-199.
Figure 3 of
McKeone, Mol Vis 2014; 20:183-199.