Figure 4. Numerical gene expression differences. Gene expression differences comparing right vs. left eyes (Normals) or treated vs.
control eyes (ML and REC). Red text indicates significant down-regulation, blue text indicates significant up-regulation and
grey text indicates that the expression difference was not statistically significant (t-test, alpha = 0.05).
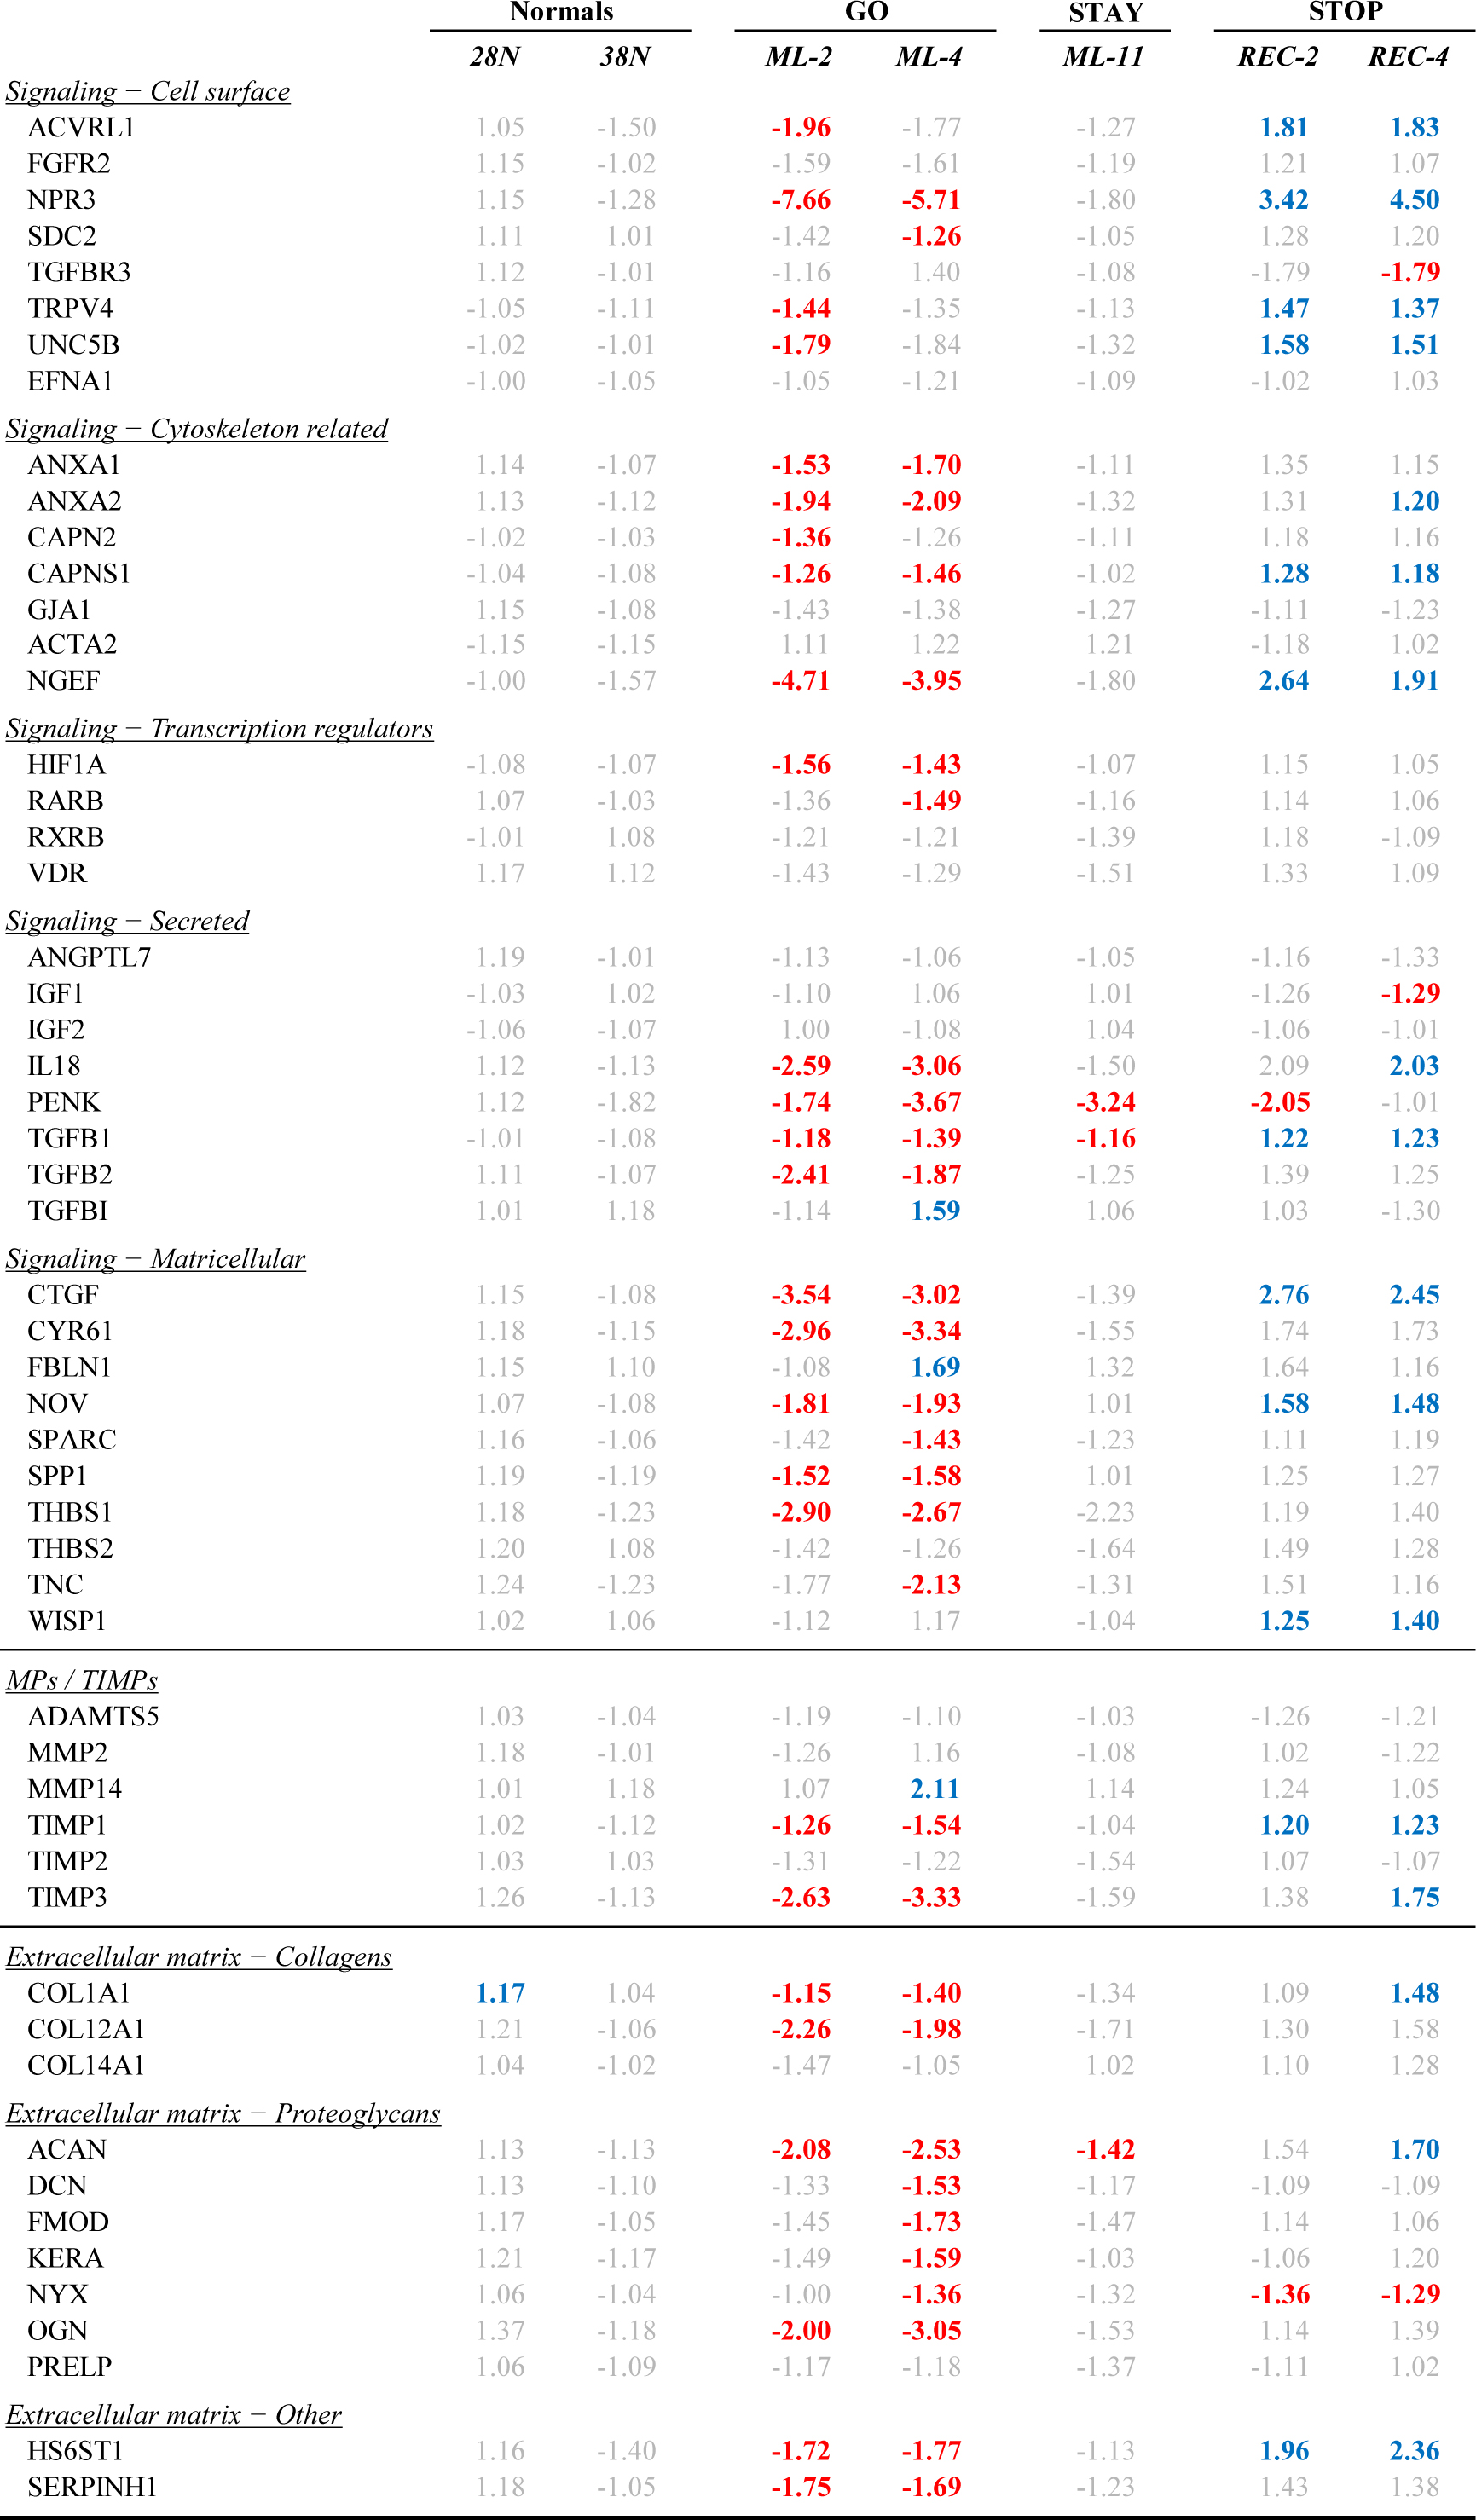
 Figure 4 of
Guo, Mol Vis 2014; 20:1643-1659.
Figure 4 of
Guo, Mol Vis 2014; 20:1643-1659.