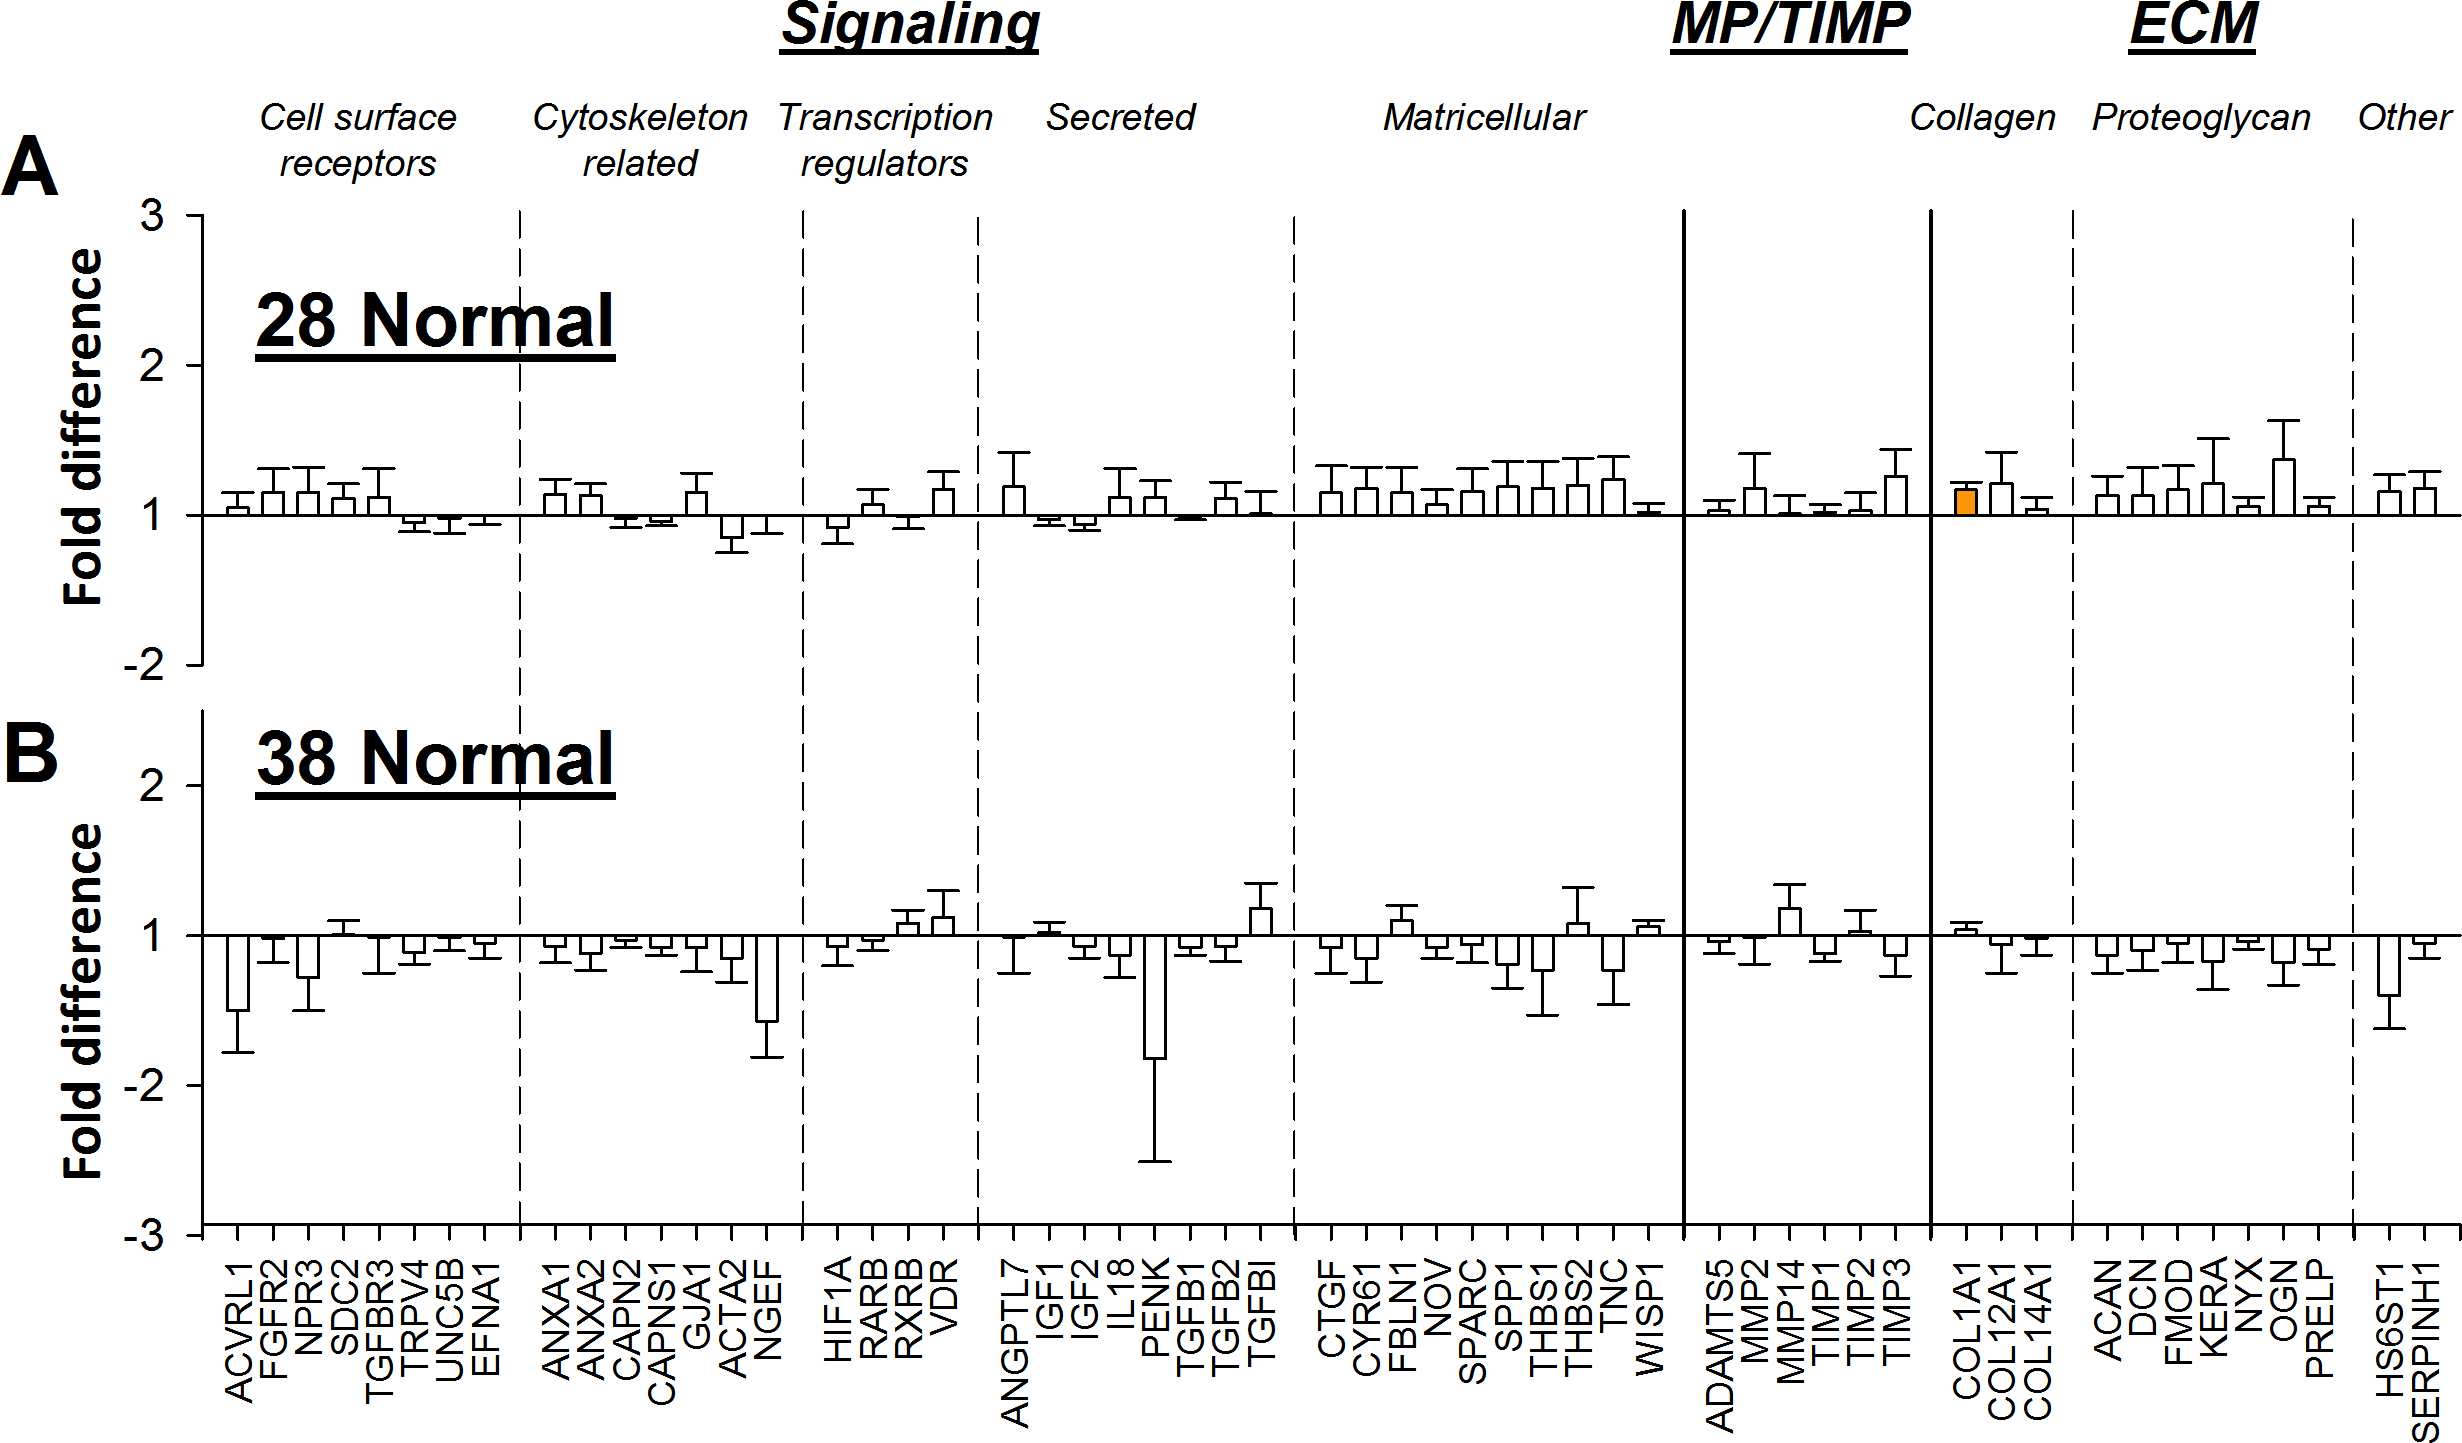
Figure 3. Gene expression differences. Comparison of gene expression fold differences in normal eyes (right versus left).
A: 28 days of visual experience (DVE) normal group.
B: 38 DVE normal group. Filled bars represent statistically significant differences between the right and left eyes (p<0.05).
A positive bar indicates that expression was higher in the right eyes. Error bars=SEM. The data in panel (
A) are reproduced with permission from [
45].
 Figure 3 of
Guo, Mol Vis 2014; 20:1643-1659.
Figure 3 of
Guo, Mol Vis 2014; 20:1643-1659.