Figure 2. Refractive differences. Refractive differences of the (A) normal and (B) minus-lens wear groups. C: Refractive recovery from full compensation. Values are the mean refractive differences±SEM for the right – left eyes of
the normal groups, and treated – control eyes for the ML and REC groups. The with-lens values in (B) show the treated eye – control eye difference while the –5 D lens was in place. Treated eyes in all groups were significantly
myopic relative to their fellow control eyes. The upward bars in (C) indicate the amount of recovery (decrease in myopia) between the start and end of recovery.
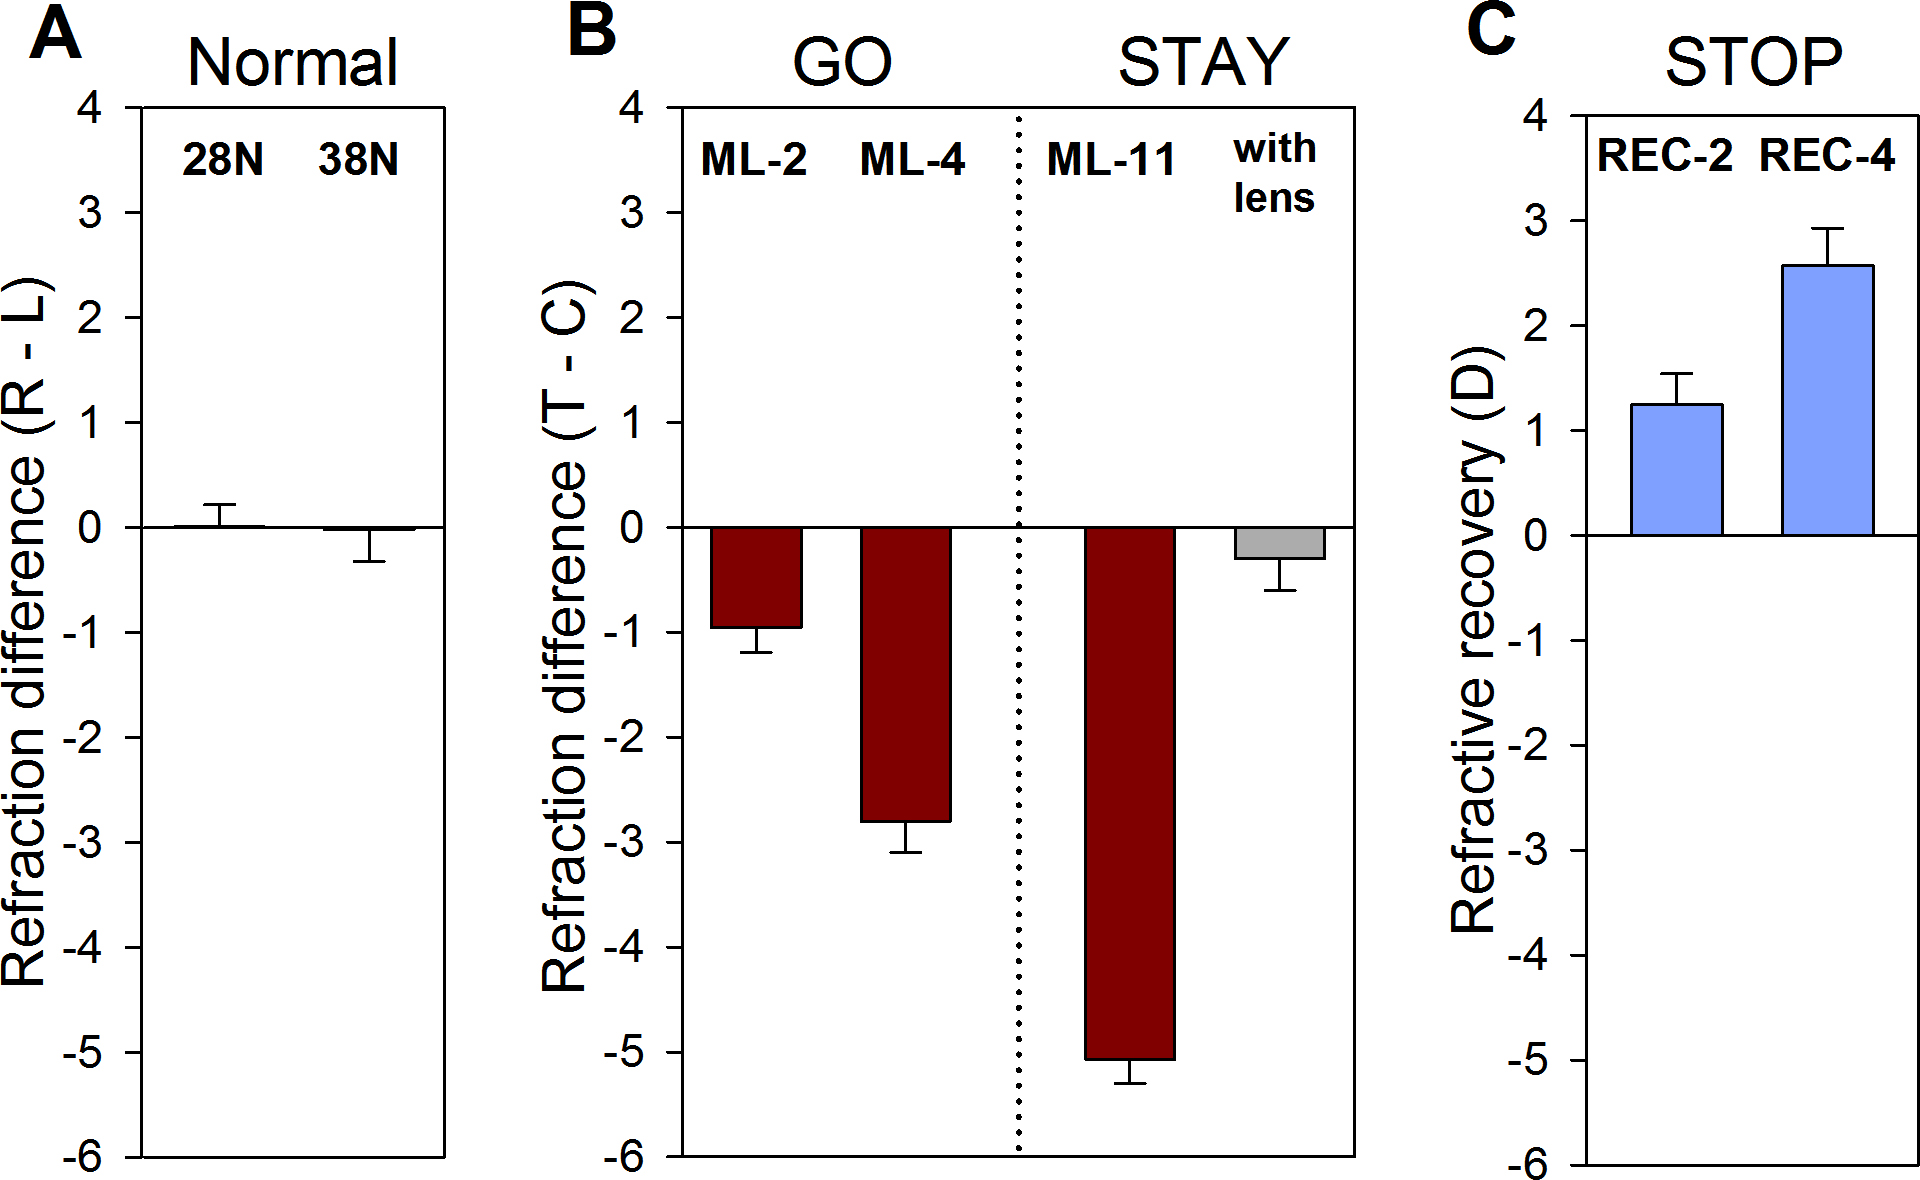
 Figure 2 of
Guo, Mol Vis 2014; 20:1643-1659.
Figure 2 of
Guo, Mol Vis 2014; 20:1643-1659.