Figure 4. Changes in exon-inclusion rates for rd10 mice occur in neuron morphogenesis and differentiation related genes. A: Ratio of increased and decreased inclusion rates for exons stratified by confidence (FDR); the majority of cases promote
increased exon usage, though this is somewhat relaxed in the highest confidence changes. B: The proportion of exons with significantly decreased usage that are categorized as coding exons, 3′ or 5′ untranslated region
(UTR) exons. C: As in B, but for exons with significantly increase usage. D: The number of genes with a given number of exons showing increased relative inclusion (y-axis) and a given number of exons
showing decreased relative inclusion (x-axis). E: The UCSC genome browser track shows changes in usage of exons within the Ncam1 transcript. F: Schematic representation of the data from panel E, showing the average proportion of reads falling within each exon and the corrected p value from a Fisher’s exact test. G: Gene Ontology (GO) terms associated with those genes that exhibit changes in splicing between the control and the rd10 samples.
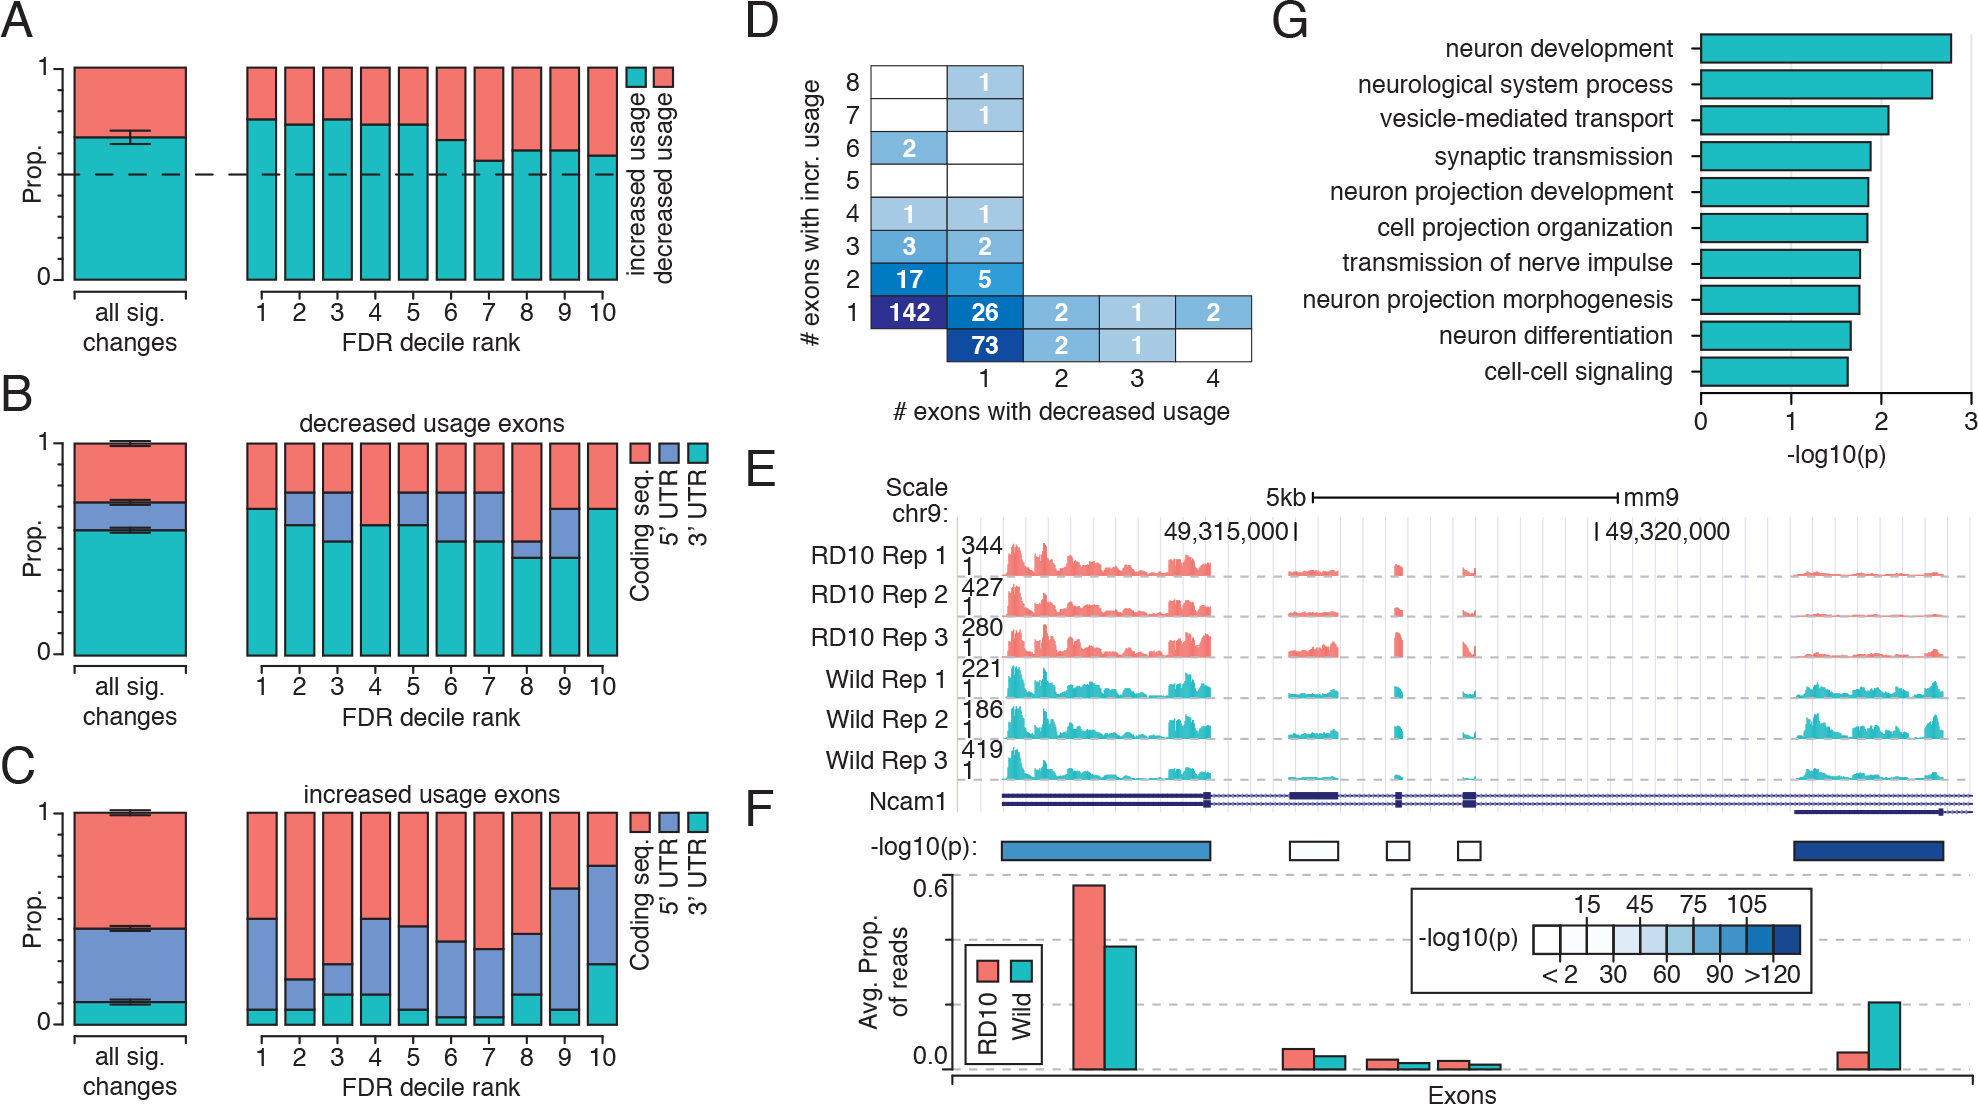
 Figure 4 of
Uren, Mol Vis 2014; 20:1612-1628.
Figure 4 of
Uren, Mol Vis 2014; 20:1612-1628.