Figure 2. Changes in mRNA levels in rd10 retina. A: The proportion of genes with increased versus decreased expression in the rd10 retina when compared to wild-type, broken into False discovery rate (FDR) quantiles based on confidence of change (genes
are considered to have increased or decreased expression if p<1×10⁻⁴). B: The expression level, as measured by RPKM (reads per kilo base of sequence per million reads mapped), in wild-type retinas
for differentially expressed genes (p<1×10⁻⁴) that showed decreased relative expression in the rd10 retina, broken into quantiles by confidence of expression change. High confidence reductions in relative expression occur
in genes with high expression in wild-type retina. C: As in B, but expression (RPKM) in the rd10 retina for genes that show significant increases in relative expression. High confidence increases in relative expression
do not show any trend towards low- or high-expression genes in rd10 retina. D: The proportions of genes observed with increased and decreased relative expression that have been described as cell-type
specific. E: Log-odds and corrected p-values for differentially expressed transcription factors (TFs) and RNA-binding proteins (RBPs).
Transcription factors and RNA-binding proteins show both increases and decreases in relative abundance, though the strongest
changes observed are decreased relative mRNA levels for a subset of transcription factors. Increased relative mRNA levels
of transcription factors and RNA-binding proteins was observed in a number of genes associated with disease progression (discussed
in text).
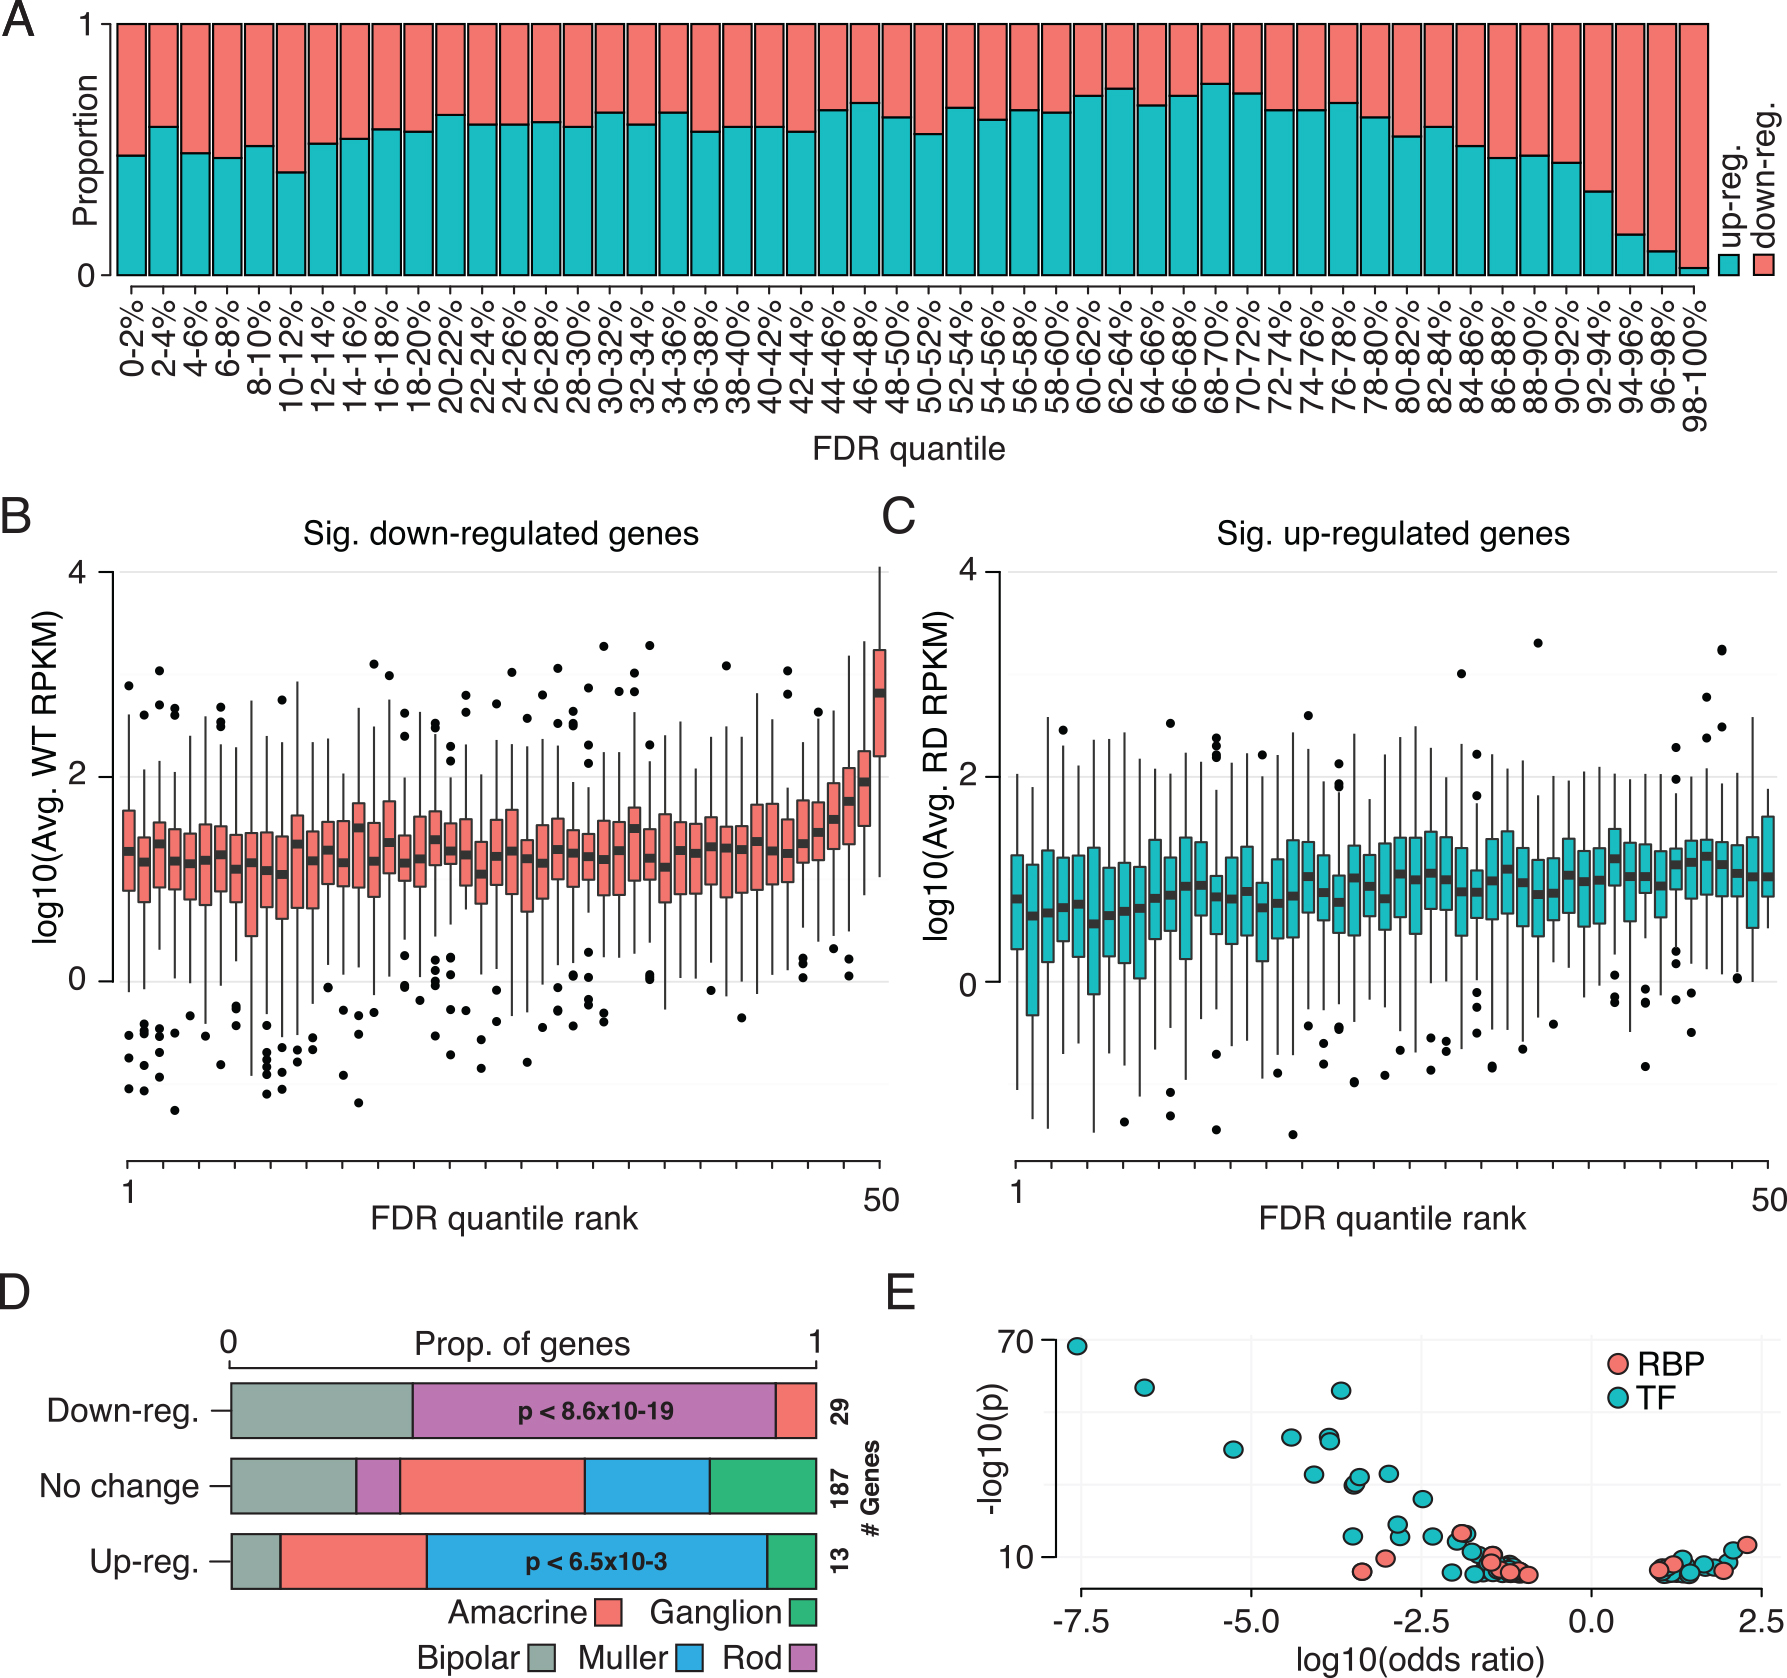
 Figure 2 of
Uren, Mol Vis 2014; 20:1612-1628.
Figure 2 of
Uren, Mol Vis 2014; 20:1612-1628.