Figure 1. Confocal images of the retina showing GFP and PKCα expression in the ON bipolar cells of the mouse retina in 60 day old mice.
A: PKCα stain of a normal retina in rod bipolar cells and the presence of the normal photoreceptor layer. B: GFP expression and PKCα in the bipolar cell layer of the Gγ13 retina and (C) the absence of photoreceptors in the rd10 retina with an intact bipolar cell layer. GFP is indicated in green in the confocal images. Red represents PKCα, a marker
for rod bipolar cells, a type of ON bipolar cell in the inner nuclear layer (INL). Blue is 4',6-diamidino-2-phenylindole (DAPI),
which stains for cell nuclei. Yellow indicates colocalization of GFP and PKCα expression. D: Correlation coefficients (Pearson’s) between replicates (each replicate is from a unique mouse) reflect high correlation
within groups; WT = wild-type mice, RD = rd10 mice, GM = Gγ13 mice.
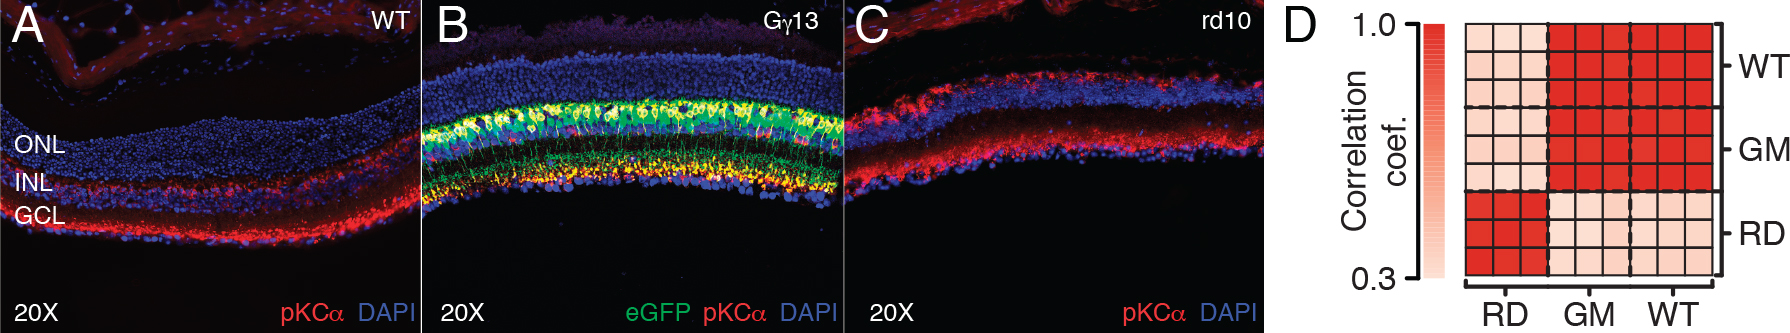
 Figure 1 of
Uren, Mol Vis 2014; 20:1612-1628.
Figure 1 of
Uren, Mol Vis 2014; 20:1612-1628.