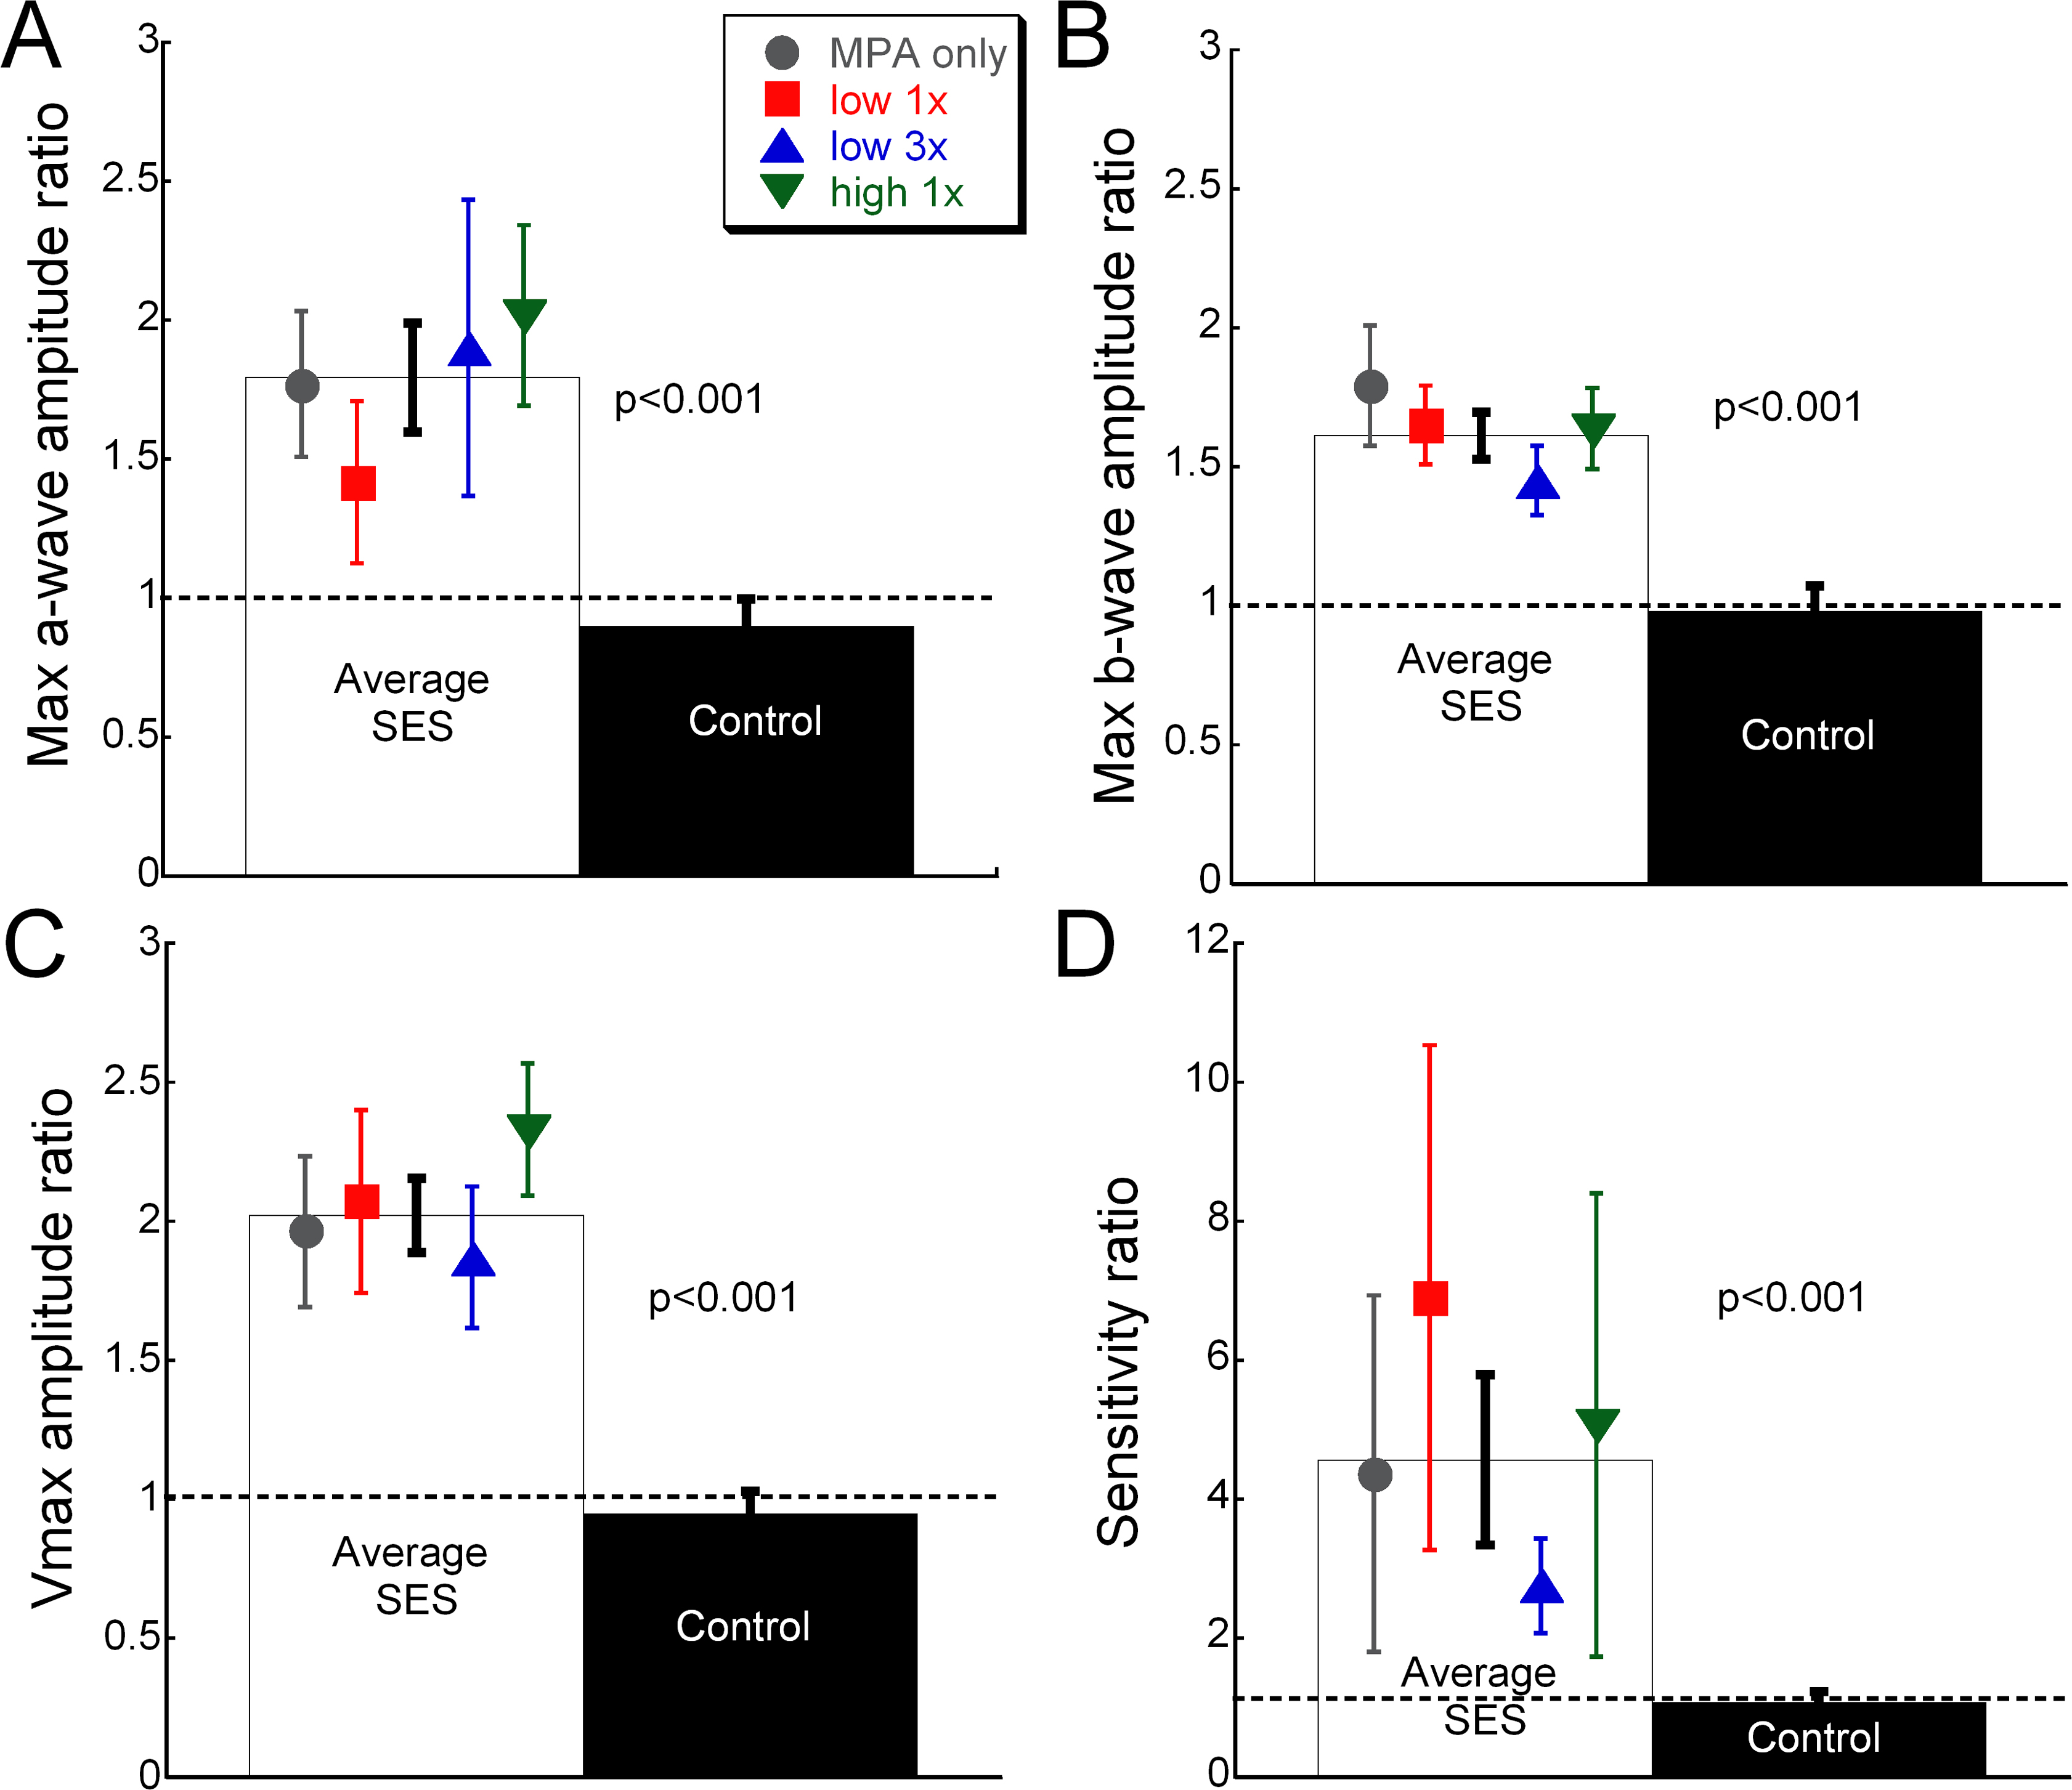
Figure 3. Assessment of electroretinogram parameters for each of the treatment groups at 4 weeks post-implantation. Symbols represent
the different microphotodiode array (MPA) and infrared (IR)-treated groups while the white bar represents the average of all
the subretinal electrical stimulation (SES)-treated eyes, which were not significantly different.
A: Amplitude ratios for maximum a-wave (
A), maximum b-wave (
B) and Vmax (
C) were significantly greater in SES-treated eyes compared to the controls (p<0.001).
D: Logσ showed that retinal sensitivity was greatest in eyes treated with SES compared to the controls (p<0.001). Animal numbers
are the same as listed for
Figure 2. Error bars represent ±SEM.
 Figure 3 of
Ciavatta, Mol Vis 2013; 19:995-1005.
Figure 3 of
Ciavatta, Mol Vis 2013; 19:995-1005.