Figure 2. Average relative amplitude and implicit time for the a- and b-wave across flash stimuli for each treatment group. Each value
is a ratio of the treated eye/maximum flash value of the control eye. A: A-wave amplitude ratios tended to be higher in eyes with subretinal electrical stimulation (SES) treatment, but this did
not reach statistical significance. B: The b-wave amplitude ratios were significantly greater in eyes receiving SES compared to the naïve controls (repeated ANOVA
F(36, 699)=6.018, p<0.001). C: The a-wave implicit time ratios were significantly faster than the control group (repeated ANOVA main effect F(4,290)=9.878,
p<0.001). D: The b-wave implicit time ratios were also significantly faster than the control group (repeated ANOVA main effect F(4,699)=7.865,
p<0.001). Error bars represent ±SEM.
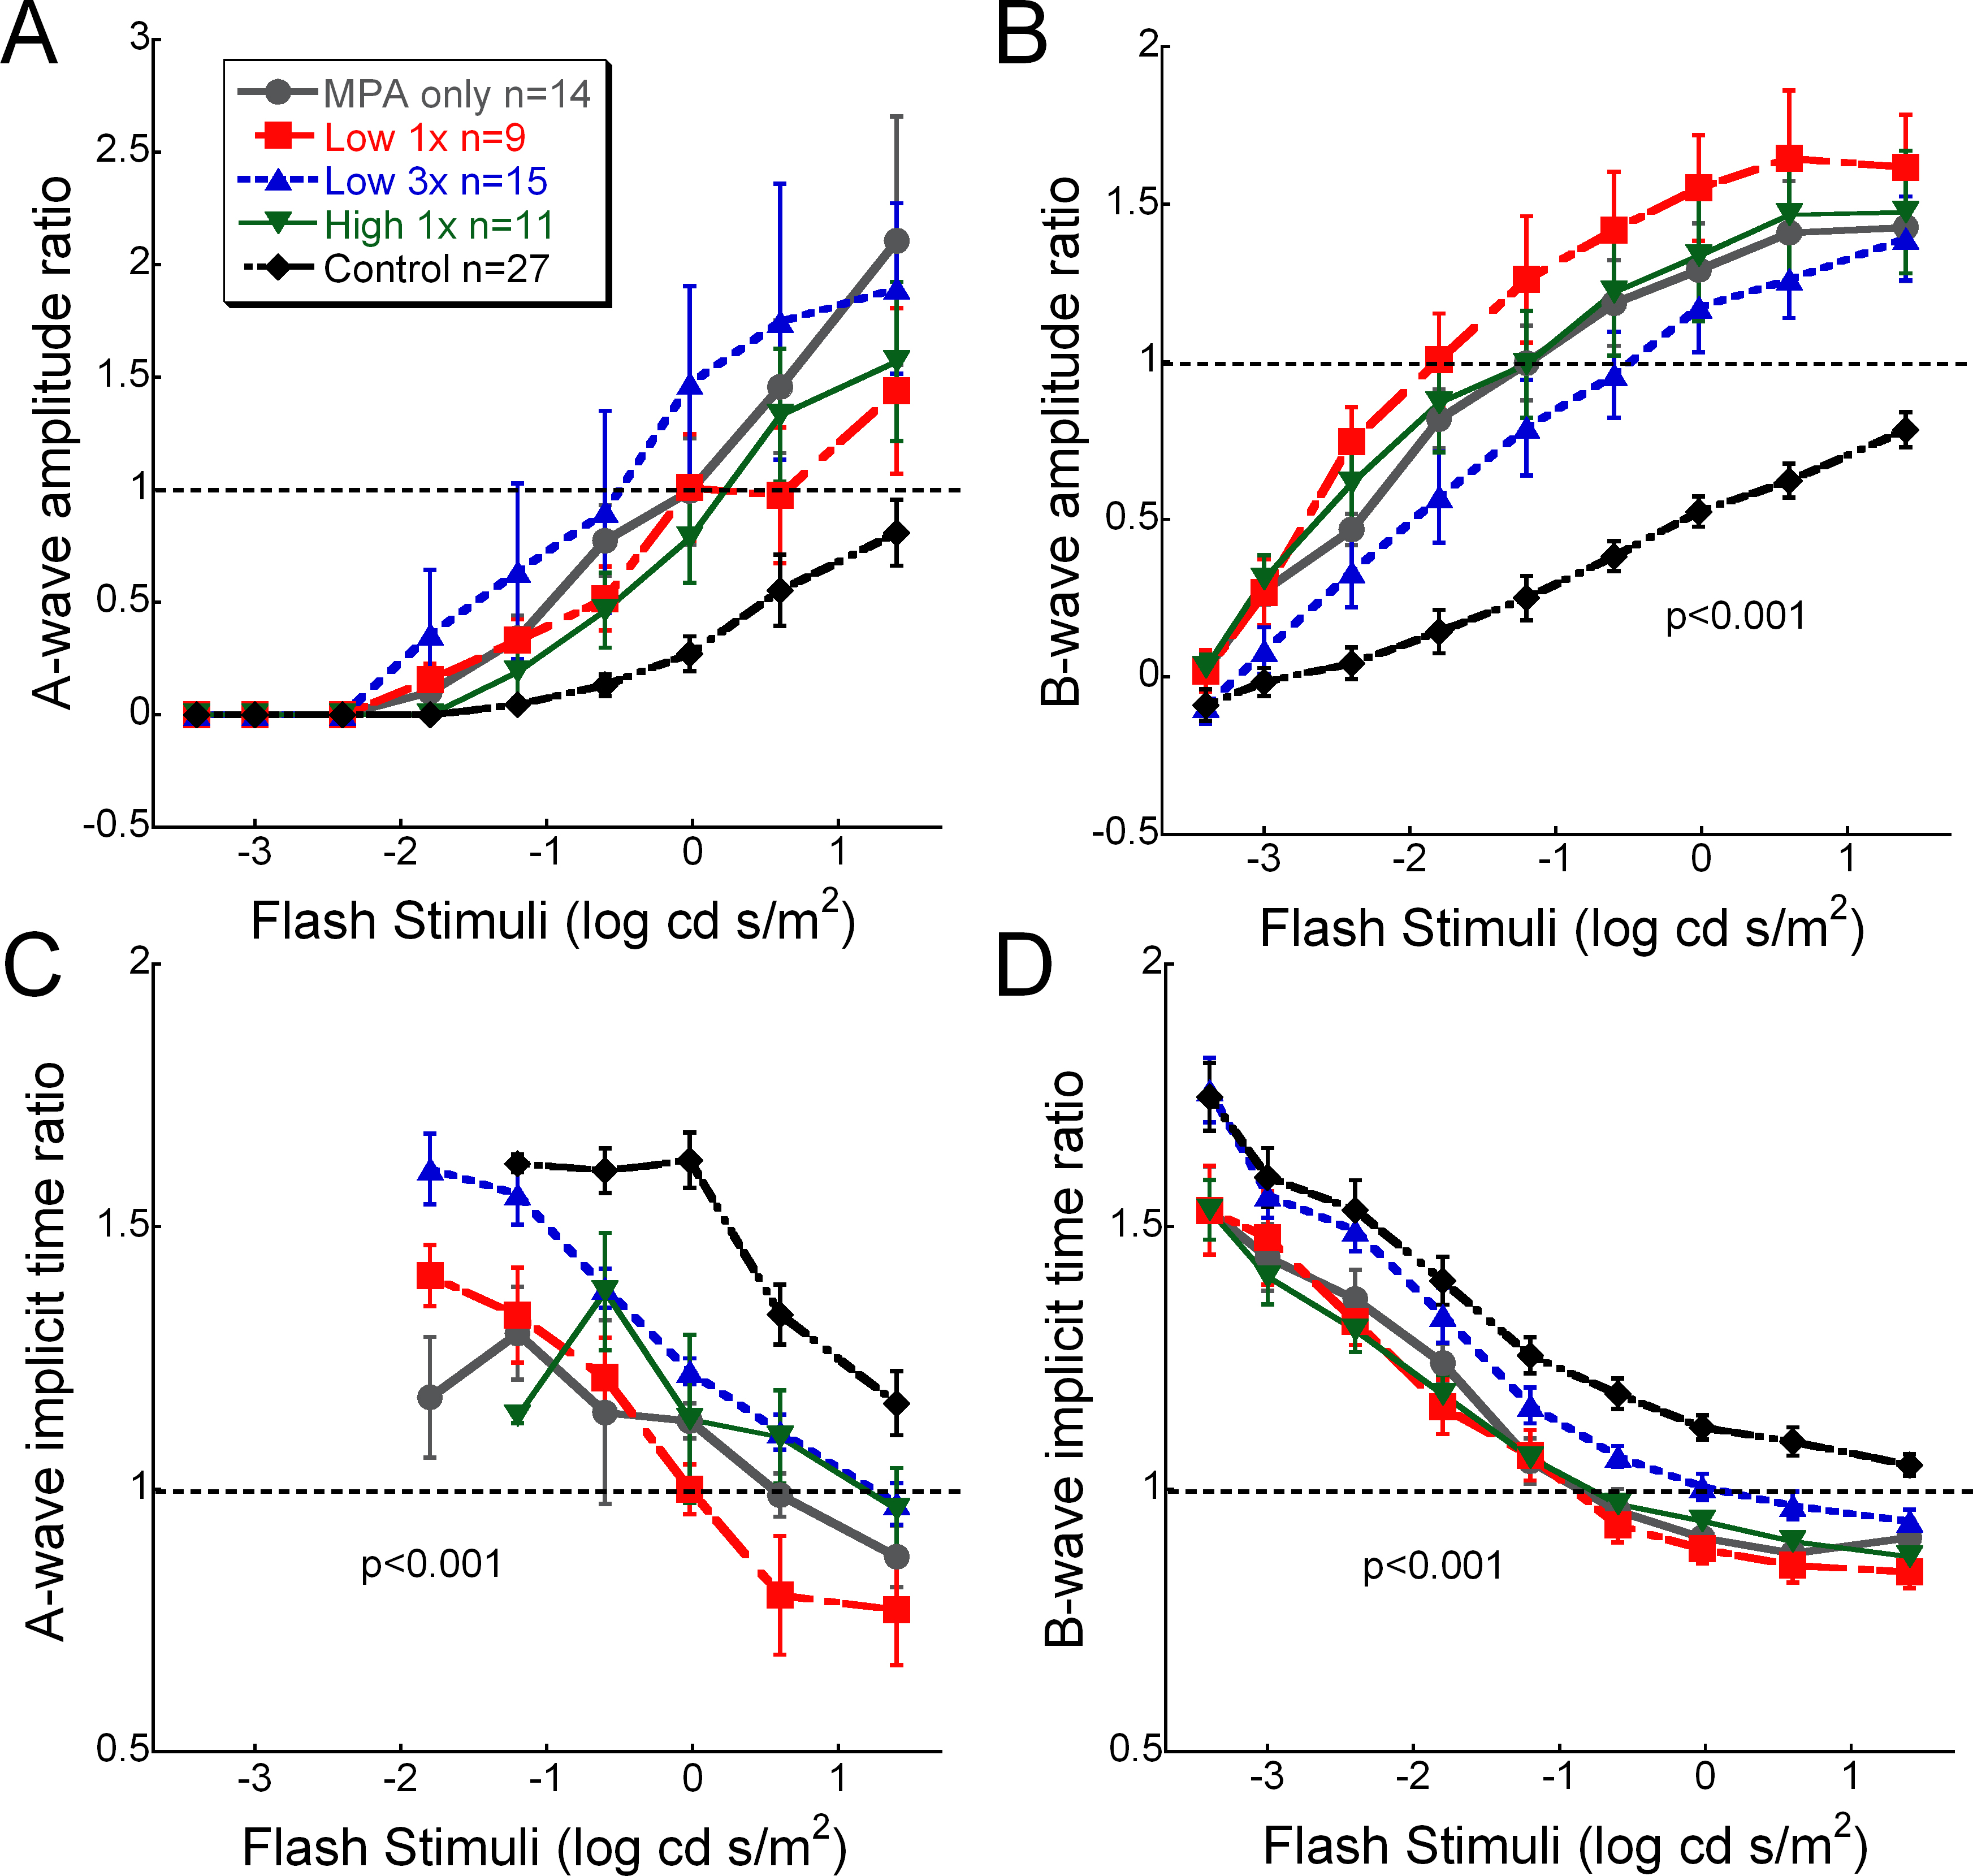
 Figure 2 of
Ciavatta, Mol Vis 2013; 19:995-1005.
Figure 2 of
Ciavatta, Mol Vis 2013; 19:995-1005.