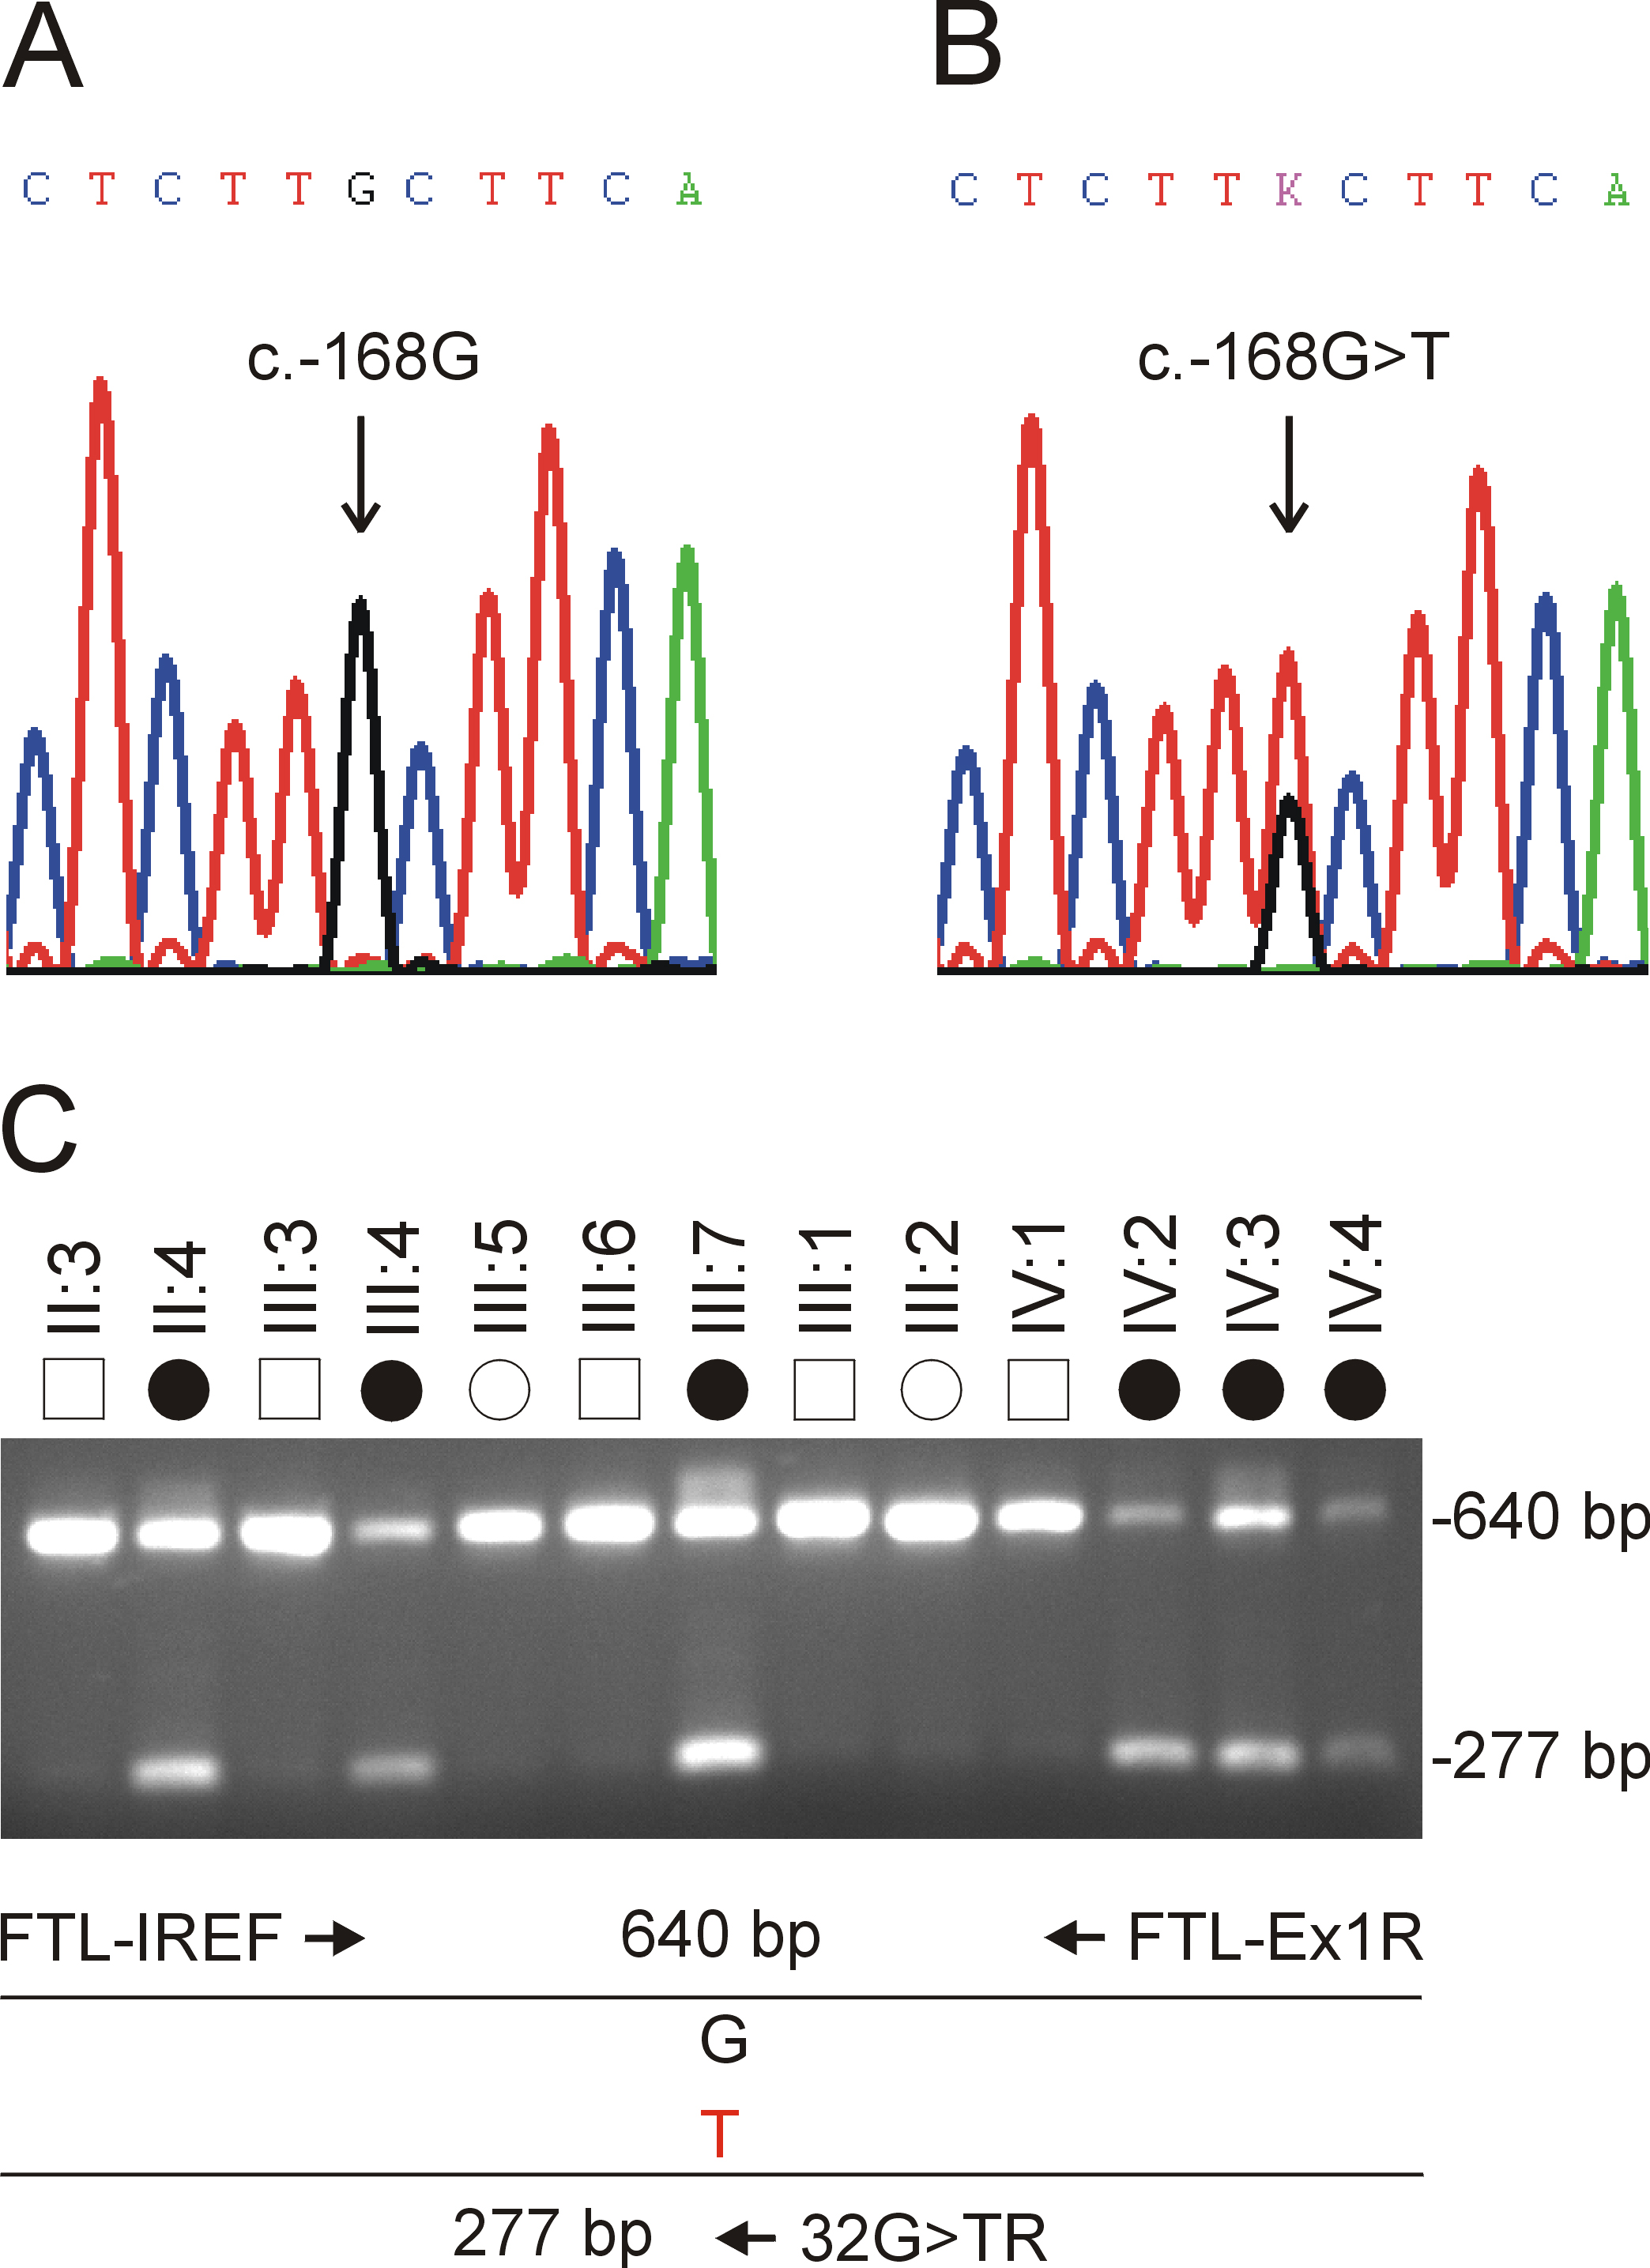
Figure 3. Mutation analysis was performed on the ferritin light chain – iron response element sequence.
A: Sequence trace of the wild-type allele shows G at nucleotide 168 upstream from the ATG (c.-168G).
B: Sequence trace of the mutant allele shows the heterozygous c.-168G>T transversion (denoted K by the International Union
of Pure and Applied Chemistry code).
C: Allele-specific PCR analysis using the three primers (
Table 1) indicated by arrows in the schematic diagram, reveals that the mutant T-allele (277 bp) co-segregates with affected but
not unaffected family members.
 Figure 3 of
Bennett, Mol Vis 2013; 19:835-844.
Figure 3 of
Bennett, Mol Vis 2013; 19:835-844.